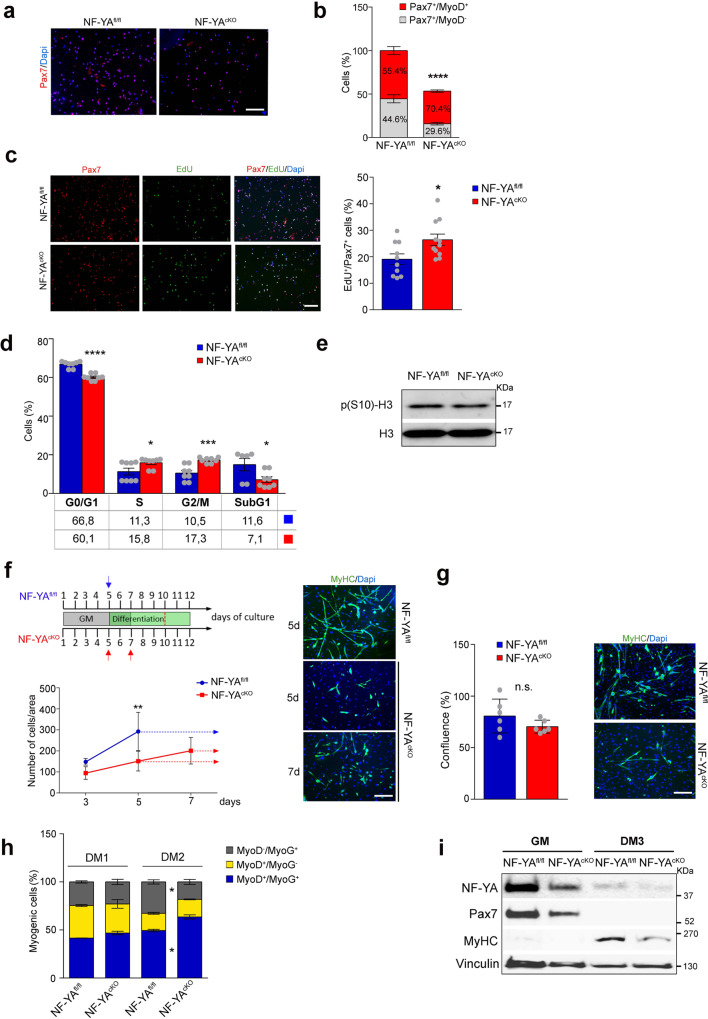
Fig. 5. Loss of NF-Y activity impairs satellite cells differentiation in vitro.
a Representative images of NF-YAfl/fl and NF-YAcKO primary SCs immunostained for Pax7 and DAPI after 4 days from isolation (n = 3 experiments). Scale bar: 100 µm. b Quantification of the percentage of Pax7 positive cells normalized on total DAPI-stained nuclei in proliferating culture conditions. The indicated percentage is related to the distribution of Pax7+/MyoD+ and Pax7+/MyoD− populations. Data represent mean ± s.d. (two-tailed unpaired t-test: ****p < 0.0001, n = 3 mice). c Immunostaining (left panel) and related quantification (right panel) of EdU+/Pax7+ cells in proliferating SCs cultures isolated from NF-YAfl/fl and NF-YAcKO. EdU (10 µM) was administered to the cells for 2 h until harvest. Data represent mean ± s.d. (two-tailed unpaired t-test: p = 0.0215; *p < 0.05, n = 10 mice). Scale bar: 100 µm. d Flow cytometry analysis of cell cycle progression in NF-YAfl/fl and NF-YAcKO SCs after 4 days from isolation. The histogram shows the distribution of cells in G0/G1 (p < 0.0001), S (p = 0.0392), G2/M (p = 0.0005) and subG1 (p = 0.0336) phases of the cell cycle. Data represent mean ± s.d. (two-tailed unpaired t-test: *p < 0.05, ***p < 0.001, ****p < 0.0001, n = 8 mice). e Western blot analysis of phospho-Ser10 histone H3 protein levels in whole-cell extracts of proliferating SCs. Total H3 was used as loading control. n = 4 experiments. f Upper panel: schematic representation of cell culture conditions and incubation times. GM = growth medium. Lower panel: proliferation curve at the indicated time points of NF-YAfl/fl and NF-YAcKO SCs maintained in growth medium (solid line) or in differentiating medium (dashed lines). Data represent mean ± s.d. (two-tailed unpaired t-test: day 5 p = 0.0041; **p < 0.05; n = 3 mice). Right panel: representative immunofluorescence images of MyHC staining of NF-YAfl/fl and NF-YAcKO SCs induced to differentiate for 5 days following 5 or 7 days from isolation. n = 3 mice, scale bar: 100 µm. g Left panel: percentage of confluence achieved by plating different NF-YAfl/fl and NF-YAcKO cell number. Data represent mean ± s.d. (two-tailed unpaired t-test: n.s. = not significant; n = 3 mice). Right panel: MyHC staining of NF-YAfl/fl and NF-YAcKO confluent SCs. h Relative distribution of NF-YAfl/fl and NF-YAcKO myogenic cells induced to differentiate for 1 (DM1) or 2 days (DM2) and stained with MyoD and MyoG antibodies. Data represent mean ± s.d. (two-tailed unpaired t-test: DM2 MyoD−/MyoG+ p = 0.0423, DM2 MyoD+/MyoG+ p = 0.0255; *p < 0.05; n = 3 mice). i Representative immunoblots of NF-YA and myogenic markers Pax7 and MyHCII protein expression in whole extracts of SCs isolated from NF-YAfl/fl and NF-YAcKO mice and cultured in growth medium (GM) and 3 days in differentiating medium (DM3). Vinculin was used as loading control. n = 3 experiments.

