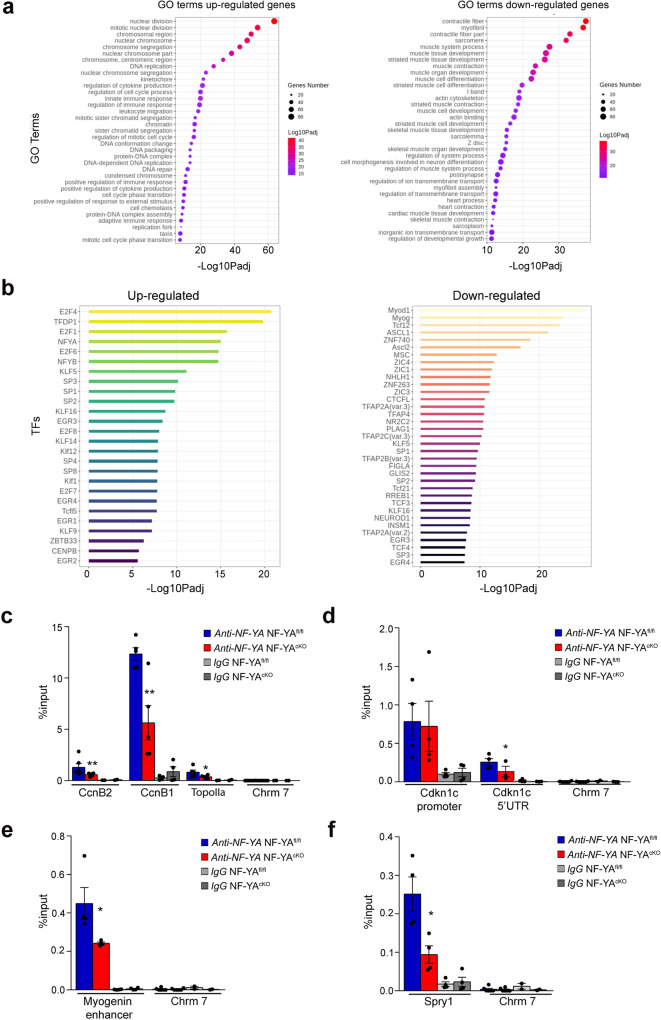
Fig. 6. Transcriptional effects of NF-YA KO in satellite cells.
a Enriched GO terms of up- (left) and down- (right) regulated genes in NF-YAcKO versus NF-YAfl/fl SCs. Circles are colored by adjusted p value (degree of enrichment) and their size commensurate with the number of genes belonging to the relative term. b Enriched transcription factor motifs (TFs) in promoters of up- (left) and down- (right) regulated genes estimated with Pscan (defined as -450/+50 bp near TSS). c qChIP analysis of NF-YA binding to promoter regions of CcnB2 (p = 0.0048), CcnB1 (p = 0.0055) and TopoIIa (p = 0.0265) genes and to regulatory regions of the Cdkn1c gene (Cdkn1c 5′UTR p = 0.0188) (d) in NF-YAfl/fl and NF-YAcKO SCs. The satellite DNA-rich heterochromatin region of chromosome 7 (Chrm 7) has been used as negative control region and IgG as negative control antibody. Data are presented as mean ± s.d. (two-tailed unpaired t-test: *p < 0.05, **p < 0.01, n = 5 mice). e qChIP analysis of NF-YA binding to E3 enhancer of Myogenin gene (p = 0.0480) or to CCAAT-promoter of Sprouty1 gene (p = 0.0194) (f). Data are presented as mean ± s.d. (two-tailed unpaired t-test: *p < 0.05, **p < 0.01, n = 4 mice).

