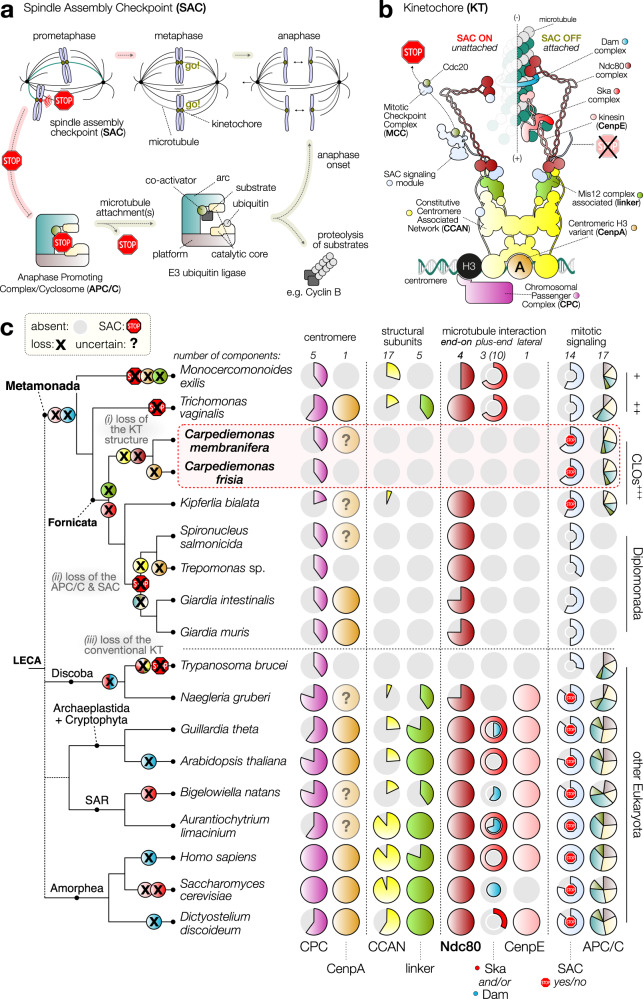
Fig. 3. Reduction of ancestral kinetochore network complexity in Carpediemonas species.
a Schematic of canonical mitotic cell cycle progression in eukaryotes. During mitosis, each duplicated chromosome attaches to microtubules (MTs) emanating from opposite poles of the spindle apparatus, in order to be segregated into two daughter cells. Kinetochores (KTs) are built upon centromeric DNA to attach microtubules to chromosomes. To prevent precocious chromosome segregation, unattached KTs signal to halt cell cycle progression (STOP), a phenomenon known as the spindle assembly checkpoint (SAC). Once all KTs are correctly attached to spindle MTs and aligned in the middle of the cell (metaphase), the checkpoint is released, and chromosome segregation is initiated (anaphase). b Cartoon of the molecular makeup of a single KT unit that was likely present in the last eukaryotic common ancestor (LECA). The cartoon depicts two different kinetochore states: unattached (left), and when bound to a microtubule (right). Colors indicate the various functional complexes and structures present in either attachment state. c Reconstruction of the evolution of the kinetochore and mitotic signaling in eukaryotes based on KT protein presence-absence patterns reveals extensive reduction of ancestral complexity and loss of the SAC in most metamonad lineages, including loss of the highly conserved core MT-binding activity of the KT (Ndc80) in Carpediemonas. On top/bottom of panel c: the number of components per complex and different structural parts of the KT, SAC signaling, and the APC/C. Middle: presence/absence matrix of KT, SAC, and APC/C complexes; one circle per complex, colors correspond to panel a and b; gray indicates its (partial) loss (for a complete overview see Supplementary Data 4 and Supplementary Fig. 6). The red STOP sign indicates the likely presence of a functional SAC response (see for discussion Supplementary Fig. 6). On the left: cartoon of a phylogenetic tree of metamonad and other selected eukaryotic species with a depiction of the loss events on each branch. Specific loss events of kinetochore and SAC genes in specific lineages are highlighted in color.

