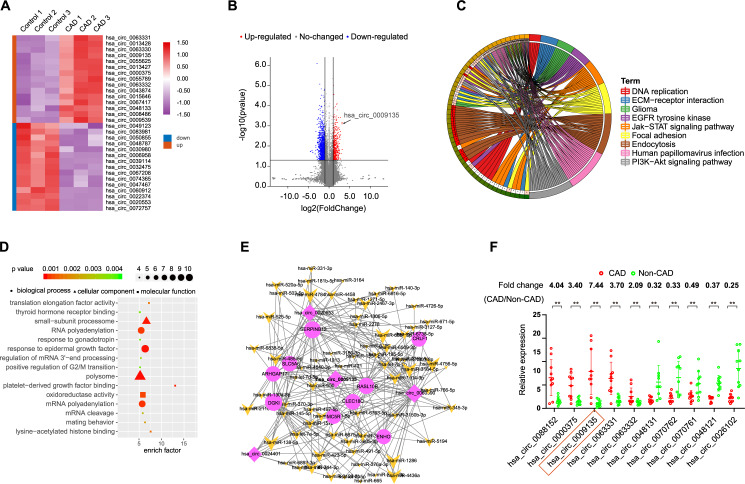
Fig. 3. Identification of differentially expressed circRNAs in sEVs from CAD patient monocytes.
A Clustered heatmap of the differentially expressed circRNAs in sEVs from monocytes. Upregulated circRNAs are shown in red and downregulated circRNAs are shown in green. B Volcano plots comparing circRNA expression between CAD patient and control. The red dots represent the significantly differentially expressed circRNAs (fold-change ≥1.5 and P < 0.01). C Top 15 classes of KEGG pathway enrichment terms. D Top 15 classes of disease enrichment terms (E) CircRNA-miRNA-mRNA network and pathway analysis. F The differential expression of 10 circRNAs in sEVs was validated in 10 monocytes from CAD patients and 10 monocytes from control using qRT-PCR. Data are presented as means ± SD; significant difference was identified with Student’s t test. *P < 0.05; **P < 0.01; ns (not significant).

