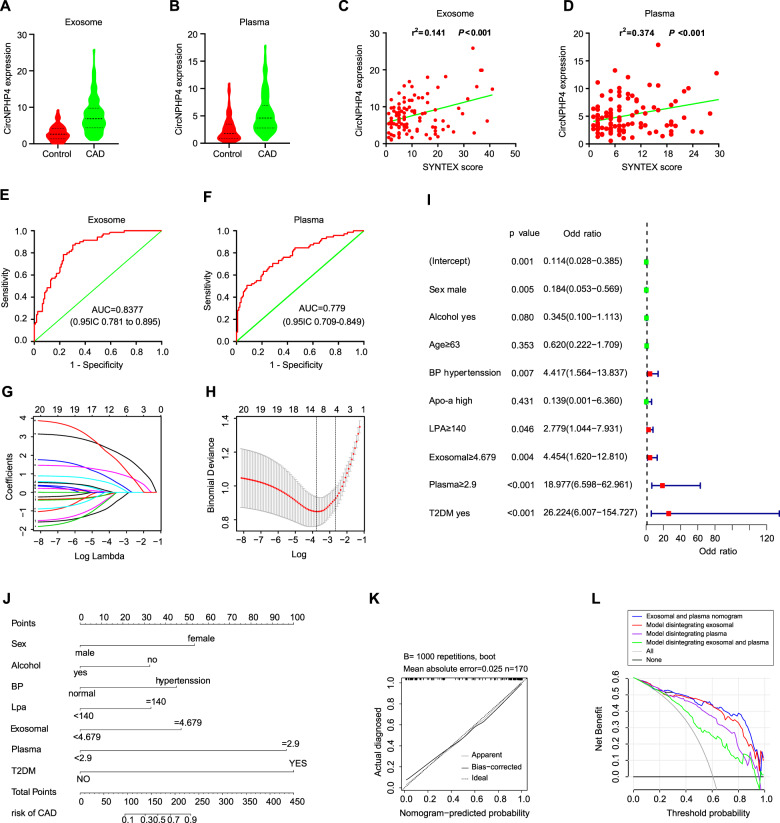
Fig. 8. CircNPHP4 upregulation in serum predicts aggressive clinicopathological characteristics.
A CircNPHP4 expression in serum from 109 CAD patients and 70 control. B CircNPHP4 expression in serum from 109 CAD patients and 70 control. C Pearson correlation between circNPHP4 expression and SYNTEX score in serum of CAD patients. D Pearson correlation between circNPHP4 expression and SYNTEX score in serum of CAD patients. E ROC curve for serum circNPHP4 that indicates a diagnostic value in CAD patients. F ROC curve for serum circNPHP4 that indicates a diagnostic value in CAD patients. G Lambda in the CAD and control cohort. H LASSO coefficient profiles of the 20 features. A coefficient profile plot was produced against the log (lambda) sequence. A vertical line was drawn at the value selected using fivefold cross-validation, where optimal lambda resulted in 9 features with nonzero coefficients. I Logistic regression analysis in the CAD and control cohort. J Nomogram using the circNPHP4 upregulation to estimate the diagnosis rate of CAD. K Calibration curves of the diagnosis prediction nomogram in the primary cohorts. L Decision curve analysis for the CAD nomogram in the cohort. The y-axis measures the net benefit. The black line represents the CAD risk nomogram. The thin solid line represents the assumption that all patients have CAD. The thick solid line represents the assumption that all patients are in Non-CAD. The decision curve shows that if the threshold probability of a patient and a doctor is >2% and <96%, respectively, using this CAD nomogram in the current study to predict CAD risk adds more benefit than the scheme.

