Figure 9.
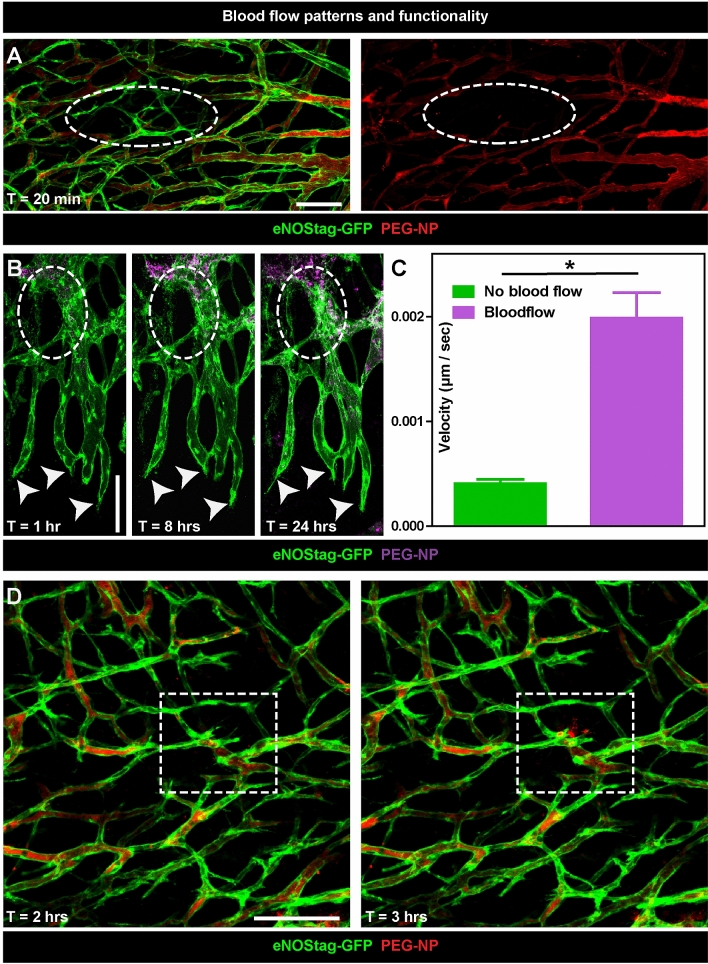
Blood flow patterns and functionality. (A) Representative 70 µm subsequential maximal projections of endothelial cells (eNOStag-GFP in green) in a Lewis lung carcinoma and blood flow (Rhodamine PEGylated nanoparticles in red) 20 min after injection of the particles. The dotted circle indicates a non-functional part of the tumor. (B) Representative 70 µm subsequential maximal projections of endothelial cells (eNOStag-GFP in green) in a B16BL6 melanoma tumor and blood flow (DiD PEGylated nanoparticles in purple) 1, 8 and 24 h after injection of the particles. The dotted circle indicates stalled blood flow followed by endothelial cell death identified by granulated cellular leftovers still fluorescent for GFP. Arrowheads indicate the lack of progression of endothelial tip cells. (C) Graph representing velocity of blood conducting versus non-blood conducting endothelial sprouts at the angiogenic front. Data represent average ± SEM of minimal five sprouts of three individual animals. *P < 0.05. (D) Representative still pictures of a sequential maximal projection of endothelial cells (eNOStag-GFP in green) in a Lewis lung carcinoma and blood flow (Rhodamine PEGylated nanoparticles in red) starting 2 h after injection. Dotted square focusses on vascular burst and extravasation of nanoparticles from the blood stream into the tumor interstitium. Scale bar represent 100 µm.

