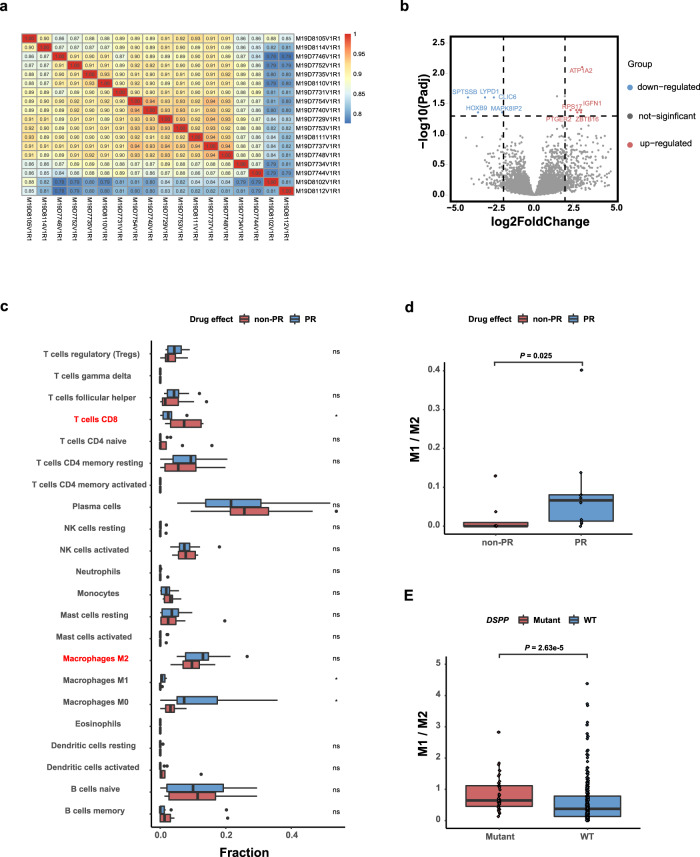
Fig. 4.
Integrated analysis of whole exome and transcriptome sequencing. a Sample correlation heat map based on expression matrix; different colors represent different correlation coefficients. b Volcano plot of eight upregulated and five downregulated differentially expressed genes between PR and non-PR group, each of them labeled the names of the first five genes. c Immune analysis of PR versus non-PR group from our cohort (Wilcoxon signed-rank test). d M1/M2 macrophage ratio of PR versus non-PR from our cohort (Wilcoxon signed-rank test). e M1/M2 macrophage ratio of DSPP-mutant versus wild-type tumors from EGFR-mutant samples obtained from TCGA (Wilcoxon signed-rank test). *P < 0.05, **P < 0.01, ***P < 0.001, ****P < 0.0001

