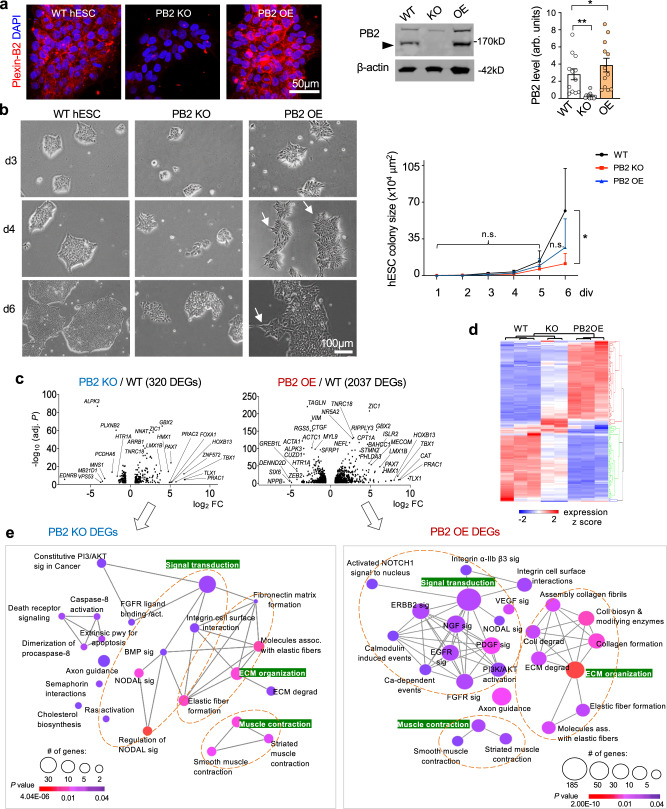
Fig. 1. Plexin-B2 controls growth and geometry of hESC colonies via mechanoregulation.
a IF images (left) show expression of Plexin-B2 (PB2) in wild-type hESC colony (clone WT#1), which was absent in PLXNB2 KO (clone KO#1) and enhanced in overexpression (OE) hESCs, respectively. Right, Western blot of hESCs probed for Plexin-B2. Arrowhead points to mature Plexin-B2 band at 170 kD. β-actin as a loading control. Quantification, one-way ANOVA followed by Dunnett’s multiple comparisons test. n = 12 samples per group. arb.units arbitrary units. *P = 0.0231, **P = 0.0034. Data represent mean ± SEM. b Phase-contrast images of the indicated hESC colonies show similar initial growth kinetics after passage, but by day 6, PLXNB2 KO colonies appeared smaller (clone #1 for each WT and KO shown). Arrows point to spiky contours of OE colonies. Quantification of colony size is shown on right. Two-way ANOVA followed by Tukey’s post hoc test. For WT colonies, n = 14, 14, 9, 10, 18, 7 for day 1–6, respectively; for PLXNB2 KO, n = 19, 14, 12, 14, 29, 25; and for PLXNB2 OE, n = 25, 15, 11, 17, 26, 23 colonies, from three independent cultures. *P = 0.0261; n.s. not significant. Data represent mean ± SEM. c Volcano plots show differentially expressed genes (DEGs) of PLXNB2 KO or OE hESCs relative to WT (cut-off thresholds: fold change >2 and P < 0.01). Top DEGs are labeled. The P values were computed by the DESeq2 package using the Wald test. d Heatmap shows unsupervised hierarchical clustering of the DEGs in different genotype conditions (fold change ≥2 between genotypes for the DEGs). e Geneset network view of enriched Reactome terms for DEGs in PLXNB2 KO or OE hESCs relative to WT. Note that gene pathways related to cell biomechanics were highly represented, as were many growth factor signaling pathways, such as EGF and FGF, that are critical for stem cell proliferation and differentiation. Highlighted in green are three major enriched pathways for the DEGs. The P values of node connectivity were computed by the Mann–Whitney–Wilcoxon test.

