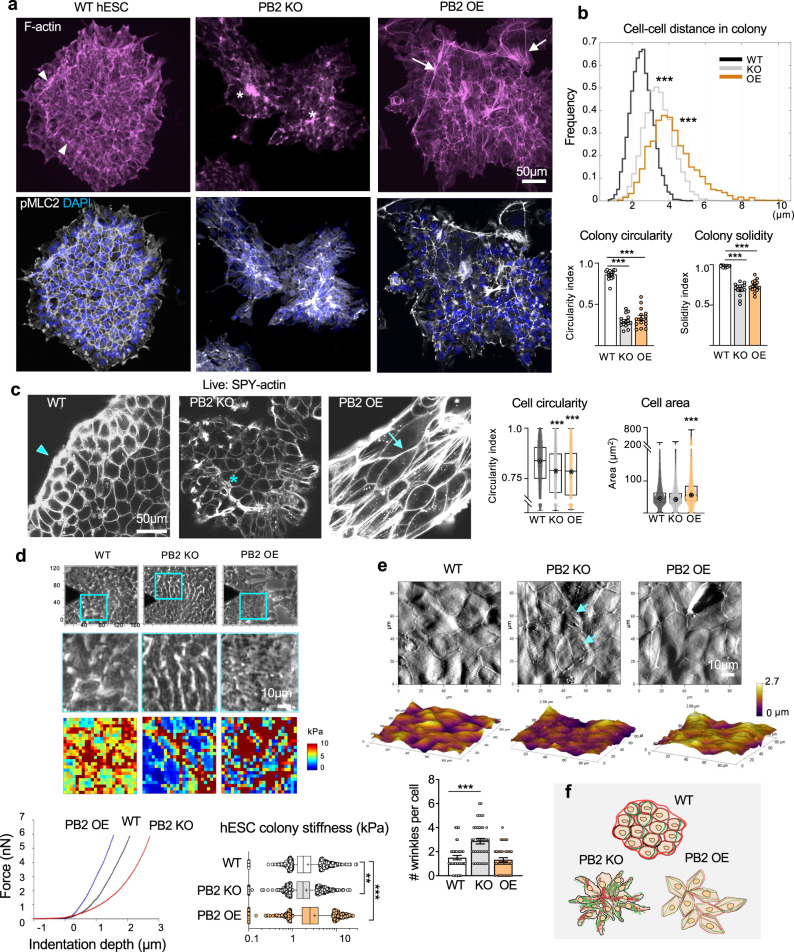
Fig. 2. Plexin-B2 orchestrates mechanotension and actomyosin network in hESC colonies.
a IF images of hESC colonies stained for F-actin (Alexa 568 phalloidin) and pMLC2 show differences in cell organization, colony geometry, and actomyosin network. Arrowheads point to the peripheral actomyosin band in the WT colony, which was disrupted in PLXNB2 KO or OE mutants. Asterisks denote abnormal cell clusters in the KO colony. Arrows point to stretched contours of the OE colony, often associated with F-actin stress fibers. DAPI for nuclear staining. b Top, histograms show the distributions of distances between neighboring cells within hESC colonies (distances between nucleus centroids). Note the wider distribution of cellular distances in KO or OE colonies than in WT, reflective of disorganization. Bottom, quantification of colony geometry (circularity index and solidity). For cell distance histogram, Kruskal–Wallis test followed by Dunn’s multiple comparisons test, n = 7646 nuclei for WT, 4478 for PLXNB2 KO, and 2964 for PLXNB2 OE. ***P < 0.0001. For colony geometries, one-way ANOVA followed by Dunnett’s multiple comparisons test, n = 15 colonies per group. ***P < 0.0001. Data represent mean ± SEM. c Live-cell imaging of hESC colonies show Plexin-B2-dependent differences in cell morphology, cell organization, and cortical F-actin visualized with SPY555-Actin probe. Arrowhead points to the peripheral F-actin band in WT colony, an asterisk denotes abnormal cell cluster in PLXNB2 KO colony (clone KO#2), and arrow points to tensed cortical F-actin and stretched junction borders in PLXNB2 OE colony. High content quantifications of cell shape (circularity index) and cell area are shown. Box plots show 25–75% quantiles, minimal and maximal values (whiskers), and median (bullseye). Kruskal–Wallis test followed by Dunn’s multiple comparisons test. For circularity: WT, n = 7878 cells; PLXNB2 KO, n = 5471, and PLXNB2 OE, n = 3904. For area: WT, n = 9725 cells; PLXNB2 KO, n = 5615, and PLXNB2 OE n = 4051. ***P < 0.0001. Data represent mean ± SEM. d Top panel, phase-contrast images show areas in hESC colonies (cyan boxes) measured by AFM elastography. Middle panels, side-by-side magnified phase-contrast images, and corresponding AFM stiffness heatmaps. Bottom, representative AFM indentation curves from elastography measurements (left) and box plots of hESC colony stiffness (right). Box plots show median, 25–75% quantiles and top and bottom 5% data points; mean values indicated by a cross sign. Kruskal–Wallis test followed by Dunn’s multiple comparisons test. Data collected from n = 7 samples for WT, n = 6 for PLXNB2 KO, and n = 7 for PLXNB2 OE. **P = 0.0032, ***P < 0.0001. e Top, AFM topography images show increased surface wrinkles in PLXNB2 KO cells (arrows), but more stretched surfaces of PLXNB2 OE cells compared to WT hESCs. Bottom, quantification of the number of surface wrinkles per cell. One-way ANOVA followed by Dunnett’s multiple comparisons test. n = 40 cells analyzed per group. ***P < 0.0001. Data represent mean ± SEM. f Schematic depiction of cell morphology, cell organization, actomyosin network, and colony geometry as regulated by Plexin-B2 during hESC self-assembly. Red lines indicate F-actin and green lines myosin.

