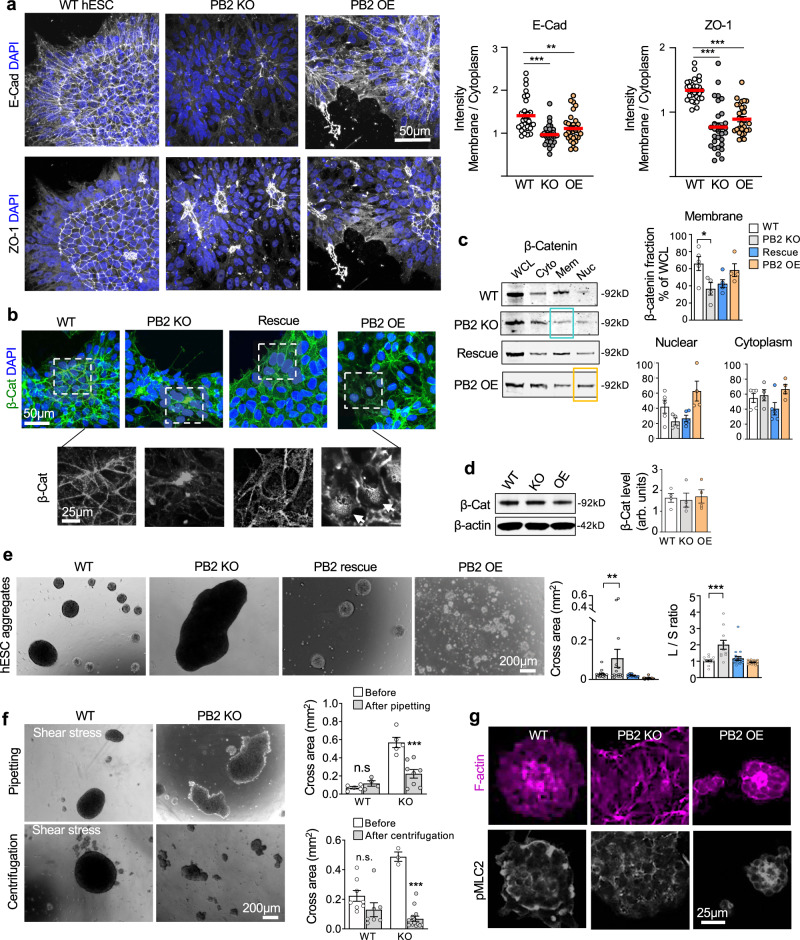
Fig. 4. Plexin-B2 influences cell–cell adhesion in multicellular organization of hESCs.
a Confocal IF images show altered junction recruitment of E-cadherin and ZO-1 in mutant hESC colonies in contrast to the organized pattern in WT colony. Data points in quantification shown on right represent boundary/cytoplasm ratios of E-cadherin and ZO-1 immunointensities. n = 30 cells per group. One-way ANOVA followed by Dunnett’s multiple comparisons test. **P = 0.0016 and ***P < 0.0001. Red lines represent mean values. b Confocal IF images reveal redistribution of β-catenin in mutant hESC colonies. Enlarged images of boxed areas are shown in bottom panels, highlighting β-catenin membrane localization in WT cells, which was shifted to the center of cell clusters in PLXNB2 KO. Arrows point to increased nuclear β-catenin in PLXNB2 OE cells. c WBs of cell fractions show a shift of membrane-associated (Mem) β-catenin to the cytoplasm (Cyto) in PLXNB2 KO hESCs (highlighted by blue box), which was rescued by CRISPR-resistant Plexin-B2. PLXNB2 OE resulted in increased nuclear (Nuc) β-catenin (highlighted by orange box). WCL whole cell lysate. Quantifications are shown to the right. One-way ANOVA followed by Tukey’s multiple comparisons test. n = 5 for WT, n = 4 for PLXNB2 KO, n = 5 for Rescue, and n = 4 for PLXNB2 OE. *P = 0.0183. Data represent mean ± SEM. d WB and quantification show comparable levels of total β-catenin in WT and PLXNB2 mutant hESCs. β-actin served as a loading control. arb.units arbitrary units. One-way ANOVA followed by Tukey’s multiple comparisons test. n = 4 samples per group. Data represent mean ± SEM. e Floating 3D hESC aggregates after 48 h culture in low adherence conditions. Quantifications of cross area and shape (L/S ratio, longest vs. shortest diameter) of aggregates are shown on the right. PB2 KO clone #1. One-way ANOVA followed by Dunnett’s multiple comparisons test. For cross area, n = 20 aggregates for WT, n = 15 for PLXNB2 KO, n = 9 for Rescue, and n = 37 for PLXNB2 OE. For L/S ratio, n = 19 aggregates for WT, n = 11 for PLXNB2 KO, n = 19 for Rescue, and n = 28 for PLXNB2 OE from 3–5 fields. **P = 0.0071, ***P < 0.0001. Data represent mean ± SEM. f Images and quantifications show the reduced capability of PLXNB2 KO hESC aggregates to withstand shear forces applied by pipetting or low-speed centrifugation compared to WT. Two-sided unpaired t-test to compare within the groups. For pipetting: WT, n = 5 aggregates before and n = 4 after; PLXNB2 KO, n = 5 before and n = 8 after. ***P = 0.0008. For centrifugation: WT, n = 8 before and n = 7 after; PLXNB2 KO, n = 3 aggregates before and n = 14 after. ***P < 0.0001; n.s. not significant. Data represent mean ± SEM. g IHC images of cross section of 3D hESC aggregates show that PLXNB2 KO resulted in cellular disarray and disorganized actomyosin networks, whereas PLXNB2 OE led to enhanced actomyosin compact.

