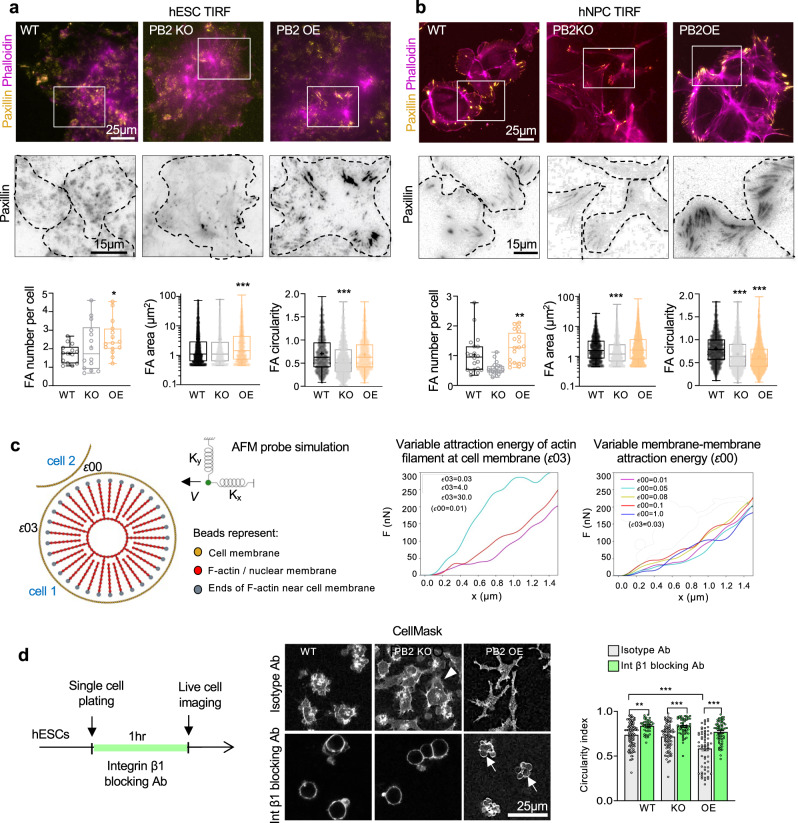
Fig. 5. Plexin-B2 influences cell–matrix adhesion and controls contractility in hESC colonies.
a, b TIRF microscopy images and quantification show altered number, size, and shape of focal adhesions (FAs) in PLXNB2 mutant hESC colonies (a) and hNPCs (b) compared to wild-type (WT) cells. Cells were stained for FA marker paxillin and F-actin (phalloidin). Enlarged images of boxed areas are shown below in inverted black and white, with dashed lines outlining individual cells. Box plots depict 25–75% quantiles, minimal and maximal values (whiskers), median (midline), and mean (cross signs). For hESCs: FA number, n = 14–15 cells per group. FA area, n = 2271 FAs for WT, n = 1042 for PB2 KO, and n = 978 for PB2 OE. FA circularity, n = 1042 FAs for WT, n = 1042 for PB2 KO, and n = 978 for PB2 OE. *P = 0.0397, ***P < 0.0001. For hNPCs: FA number, n = 20 cells per group. FA area and circularity, n = 1829 FAs for WT, n = 2385 for PB2 KO, and n = 4528 for PB2 OE. Kruskal–Wallis test followed by Dunn’s multiple comparisons test. **P = 0.0084, ***P < 0.0001. c Molecular dynamics mathematical simulation. Left, components of simulation based on a bead-spring model. The tip of the simulated AFM probe is depicted as a green sphere, with elastic constants Kx and Ky in the x and y directions, respectively. Right, graphs of force as a function of distance traveled by the simulated AFM probe in two different scenarios. Left, when varying the actin-membrane attraction energy that simulates increasing contractility, the response of the force to the virtual AFM probe resembles the results of the experimental AFM data in accordance to Plexin-B2 activity (see Fig. 2). Such result is not seen when varying membrane-membrane attraction energy (right). d Left, experimental design for live-cell imaging. Middle, images of hESCs labeled with CellMask reveal distinct cell morphology when exposed to a function-blocking antibody against integrin β1 (P5D2) or an isotype control IgG. Arrowhead points to cellular protrusion from PLXNB2 KO hESCs. Arrows point to cell membrane blebbing of PLXNB2 OE hESCs after integrin blockade. Quantification for cell roundness (circularity index) is shown on right. One-way ANOVA followed by Tukey’s multiple comparisons test. For isotype IgG treatment: n = 100 cells for WT, n = 80 cells for PB2 KO, and n = 63 for PB2 OE. For integrin β1 treatment: n = 41 cells for WT, n = 54 for PB2 KO, and n = 63 cells for PB2 OE. **P = 0.0025 and ***P < 0.0001. Data represent mean ± SEM.

