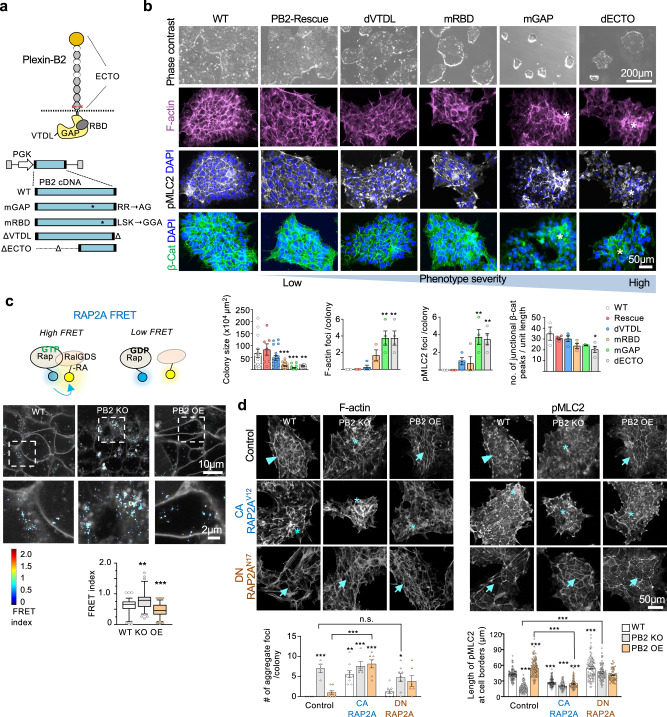
Fig. 6. Plexin-B2 signals through RAP1/2 to orchestrate cell mechanics in hESC colonies.
a Top, Plexin-B2 domain structure: ECTO ectodomain, RBD Rho-binding domain, GAP Ras-GTPase domain, VTDL, four C-terminal amino acids, forming PDZ binding motif. The cleavage site of mature Plexin-B2 is depicted by red arrows. Bottom, lentiviral vectors expressing wild-type (WT) Plexin-B2 or signaling mutants (CRISPR-KO resistant): mGAP mutation in GAP, mRBD mutation in RBD, ΔVTDL deletion of VTDL, ΔECTO deletion of ECTO domain. b Phase-contrast and confocal images illustrate the severity of cytoskeletal disarray and β-catenin membrane distribution phenotypes of hESC colonies expressing wild-type or Plexin-B2 signaling mutants (in the background of PLXNB2 KO). Asterisks denote abnormal cell clusters within the colony. Quantifications are shown below. One-way ANOVA followed by Tukey’s multiple comparisons test. For hESC colony size: n = 14 colonies for WT, n = 7 for Rescue, n = 18 for dVTDL, n = 24 for mRBD, n = 21 for mGAP, and n = 12 for dECTO. **P = 0.0028; ***P < 0.0003 (WT vs mRBD), ***P < 0.0001 (WT vs mGAP). For others, n = 3–4 for each group. For F-actin foci, **P = 0.002. For pMLC2 foci, **P = 0.0019 (WT vs. mGAP) and **P = 0.0037 (WT vs. dECTO). For junctional β-cat peaks, *P = 0.025. Data represent mean ± SEM. c Top, diagram of FRET probes for RAP2A activation status. Middle, representative images of normalized RAP2A FRET signals in WT, PLXNB2 KO (clone #3), PLXNB2 OE hESCs. Enlarged images of boxed areas are shown below. Box plots show median, 25–75% quantiles, and top or bottom 5% data points. Kruskal–Wallis test followed by Dunn’s multiple comparisons test. n = 98 cell–cell membrane areas for WT; n = 89 for PB2 KO; n = 85 for PLXNB2 OE. **P = 0.0013 and ***P < 0.0001. d Confocal IF images show the effects of RAP2A isoforms on cortical actomyosin network, colony geometry, and cellular organization of hESC colonies as compared to control colonies with no RAP2A expression vector. Arrowheads point to the peripheral F-actin band in WT colony, asterisks denote abnormal cell cluster in PLXNB2 KO colony, and arrows point to tensed cortical F-actin and stretched junction borders in PLXNB2 OE colony. Note that constitutively active (CA) RAP2AV12 phenocopied Plexin-B2 KO (clone #3), whereas dominant-negative (DN) RAP2AN17 phenocopied Plexin-B2 OE. Quantifications of actomyosin aggregate foci per colony and length of pMLC2 at cell borders are shown below. For aggregate foci: control, n = 4 colonies for WT, n = 4 for PB2 KO, and n = 8 for PB2 OE; CA RAP2AV12, n = 9 for WT, n = 5 for PB2 KO, and n = 7 for PB2 OE; DN RAP2AN17, n = 9 for WT, n = 8 for PB2 KO, and n = 6 for PB2 OE. *P = 0.010, **P = 0.0017, ***P < 0.0001. For pMLC2: control, n = 80–100 cell borders for each genotype; CA RAP2AV12, n = 60–70 for each genotype; DN RAP2AN17, WT, n = 50–90 for each genotype. ***P < 0.0001. One-way ANOVA followed by Dunnett’s post hoc correction to compare to WT group. A two-sided unpaired t-test was applied when comparing data from two groups (brackets). Data represent mean ± SEM.

