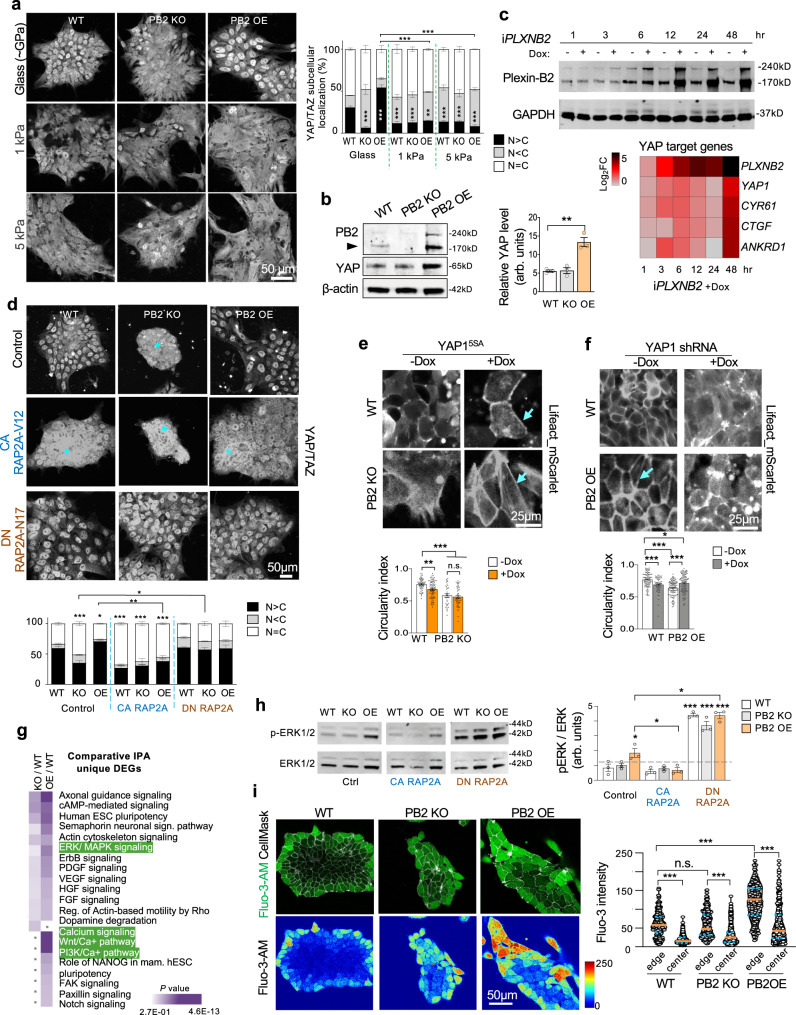
Fig. 7. Plexin-B2 engages the YAP mechanotransduction pathway and activates ERK1/2 and calcium signaling.
a Confocal IF images show reduced nuclear YAP/TAZ in PLXNB2 KO hESCs, but a cytoplasm-to-nucleus shift in PLXNB2 OE as compared to WT cells on standard cell culture substrate (glass coverslip coated with Matrigel). Cultures on hydrogels with softer stiffness (1 and 5 kPa) is similar for all genotype groups with a strong reduction of nuclear YAP/TAZ. Quantifications show relative fractions of cells with nuclear YAP/TAZ signals that are greater, equal, or smaller than cytoplasmic signals (N > C, N = C, N < C). Two-way ANOVA followed by Dunnett’s post hoc test to compare to WT. n = 115–301 cells for each condition **P = 0.0019, ***P = 0.0001 (WT glass vs KO and OE glass), ***P = 0.0002 (WT glass vs WT 1 kPa), ***P = 0.0004 (WT glass vs KO 1 kPa), ***P = 0.0008 (WT glass vs WT 5 kPa), ***P = 0.0009 (WT glass vs KO 5 kPa), ***P = 0.0001 (WT glass vs OE 5 kPa). A two-sided unpaired t-test was applied when comparing data from two groups (brackets). ***P = 0.0002 (OE Glass vs OE 1 kPa, and OE Glass vs OE 5 kPa), Data represent mean ± SEM. b WB and quantification show an increased level of total YAP in PLXNB2 OE cells as compared to WT or PLXNB2 KO hESCs. Arrowhead points to mature Plexin-B2 band. β-actin served as a loading control. arb.units arbitrary units. One-way ANOVA followed by Tukey’s multiple comparisons test. n = 3 samples per group. **P = 0.0017. Data represent mean ± SEM. c Top, WB shows time course of Dox-induced expression of Plexin-B2 (iPLXNB2) in hESCs. GAPDH served as a loading control. Bottom, heatmap of qRT-PCR data illustrates upregulation of YAP1 and its target genes CYR61, CTGF, and ANKRD1 upon Plexin-B2 induction. The heatmap was generated by the mean value from n = 3 independent cultures. d IF images show the effects of RAP2A isoforms on YAP/TAZ nuclei/cytoplasmic localization in hESC colonies. Note that expression of constitutive active RAP2AV12 led to elevated cytoplasmic YAP/TAZ in all three groups, phenocopying Plexin-B2 KO. Quantification shows relative fractions of cells with nuclear YAP/TAZ immunosignals that are greater, equal, or smaller than cytoplasmic signals (N > C, N = C, N < C). Two-way ANOVA followed by Dunnett’s post hoc test to compare to WT group. For control, n = 330–466 cells for each genotype; for CA RAP2AV12, n = 163–233 for each genotype; for DN RAP2AN17, n = 412–543 for each genotype *P = 0.040 and ***P < 0.0001. A two-sided unpaired t-test was applied when comparing data from two groups (brackets). *P = 0.015, **P = 0.0012. Data represent mean ± SEM. e, f Live-cell imaging shows differences in cortical F-actin (visualized by LifeAct_mScarlet) in hESCs with Dox-inducible expression of YAP15SA (e) or YAP1 shRNA (f). Arrows point to tensed cortical F-actin and stretched cell borders. Data represent mean ± SEM. One-way ANOVA with Tukey’s post hoc test. For YAP15SA: WT, n = 54–80 cells; PB2 KO, n = 33–50 cells. **P = 0.0053 and ***P < 0.0001. For YAP1 shRNA: WT, n = 62–89 cells; PB2 OE, n = 100 cells each. *P = 0.012 and ***P < 0.0001. n.s. not significant. Data represent mean ± SEM. g Comparative Ingenuity pathway analysis (IPA) of enriched gene pathways for the unique DEGs identified in PLXNB2 KO or OE hESCs relative to WT. Note the enhanced activation of ERK/MAPK and calcium signaling in Plexin-B2 OE cells. The categories are ranked by adjusted P value computed by IPA’s Fisher’s Exact Test. h WBs show increased ERK1/2 phosphorylation (p-ERK1/2) in PLXNB2 OE cells compared to WT. p-ERK1/2 was further increased by DN RAP2AN17 expression in all three groups (WT, PB2 KO, and PB2 OE). In contrast, CA RAP2AV12 expression resulted in reduced p-ERK1/2 in PLXNB2 OE cells. ERK1/2 served as a loading control. arb.units arbitrary units. One-way ANOVA followed by Dunnett’s post hoc correction to compare to WT group. A two-sided unpaired t-test was applied when comparing data from two groups (brackets). n = 3 samples per group. *P = 0.017 (WT vs. PB2 OE), *P = 0.028 (Control PB2 OE vs. CA RAP2AV12 PB2 OE), *P = 0.0024 (Control PB2 OE vs. DN RAP2AN17 PB2 OE), ***P < 0.0001. Data represent mean ± SEM. i Calcium imaging with Fluo-3-AM dye shows higher levels of intracellular calcium in hESCs at colony edges compared to central areas. Calcium signals were elevated in PLXNB2 OE. Kruskal–Wallis test followed by Dunn’s multiple comparisons test. For colony edges, n = 328, 332, and 116 for WT, PB2 KO, and PB2 OE, respectively. For colony center, n = 1000, 648, 417 cells for WT, PB2 KO, and PB2 OE, respectively. ***P < 0.0001. Orange lines indicate median values and blue lines 25 and 75% percentiles.

