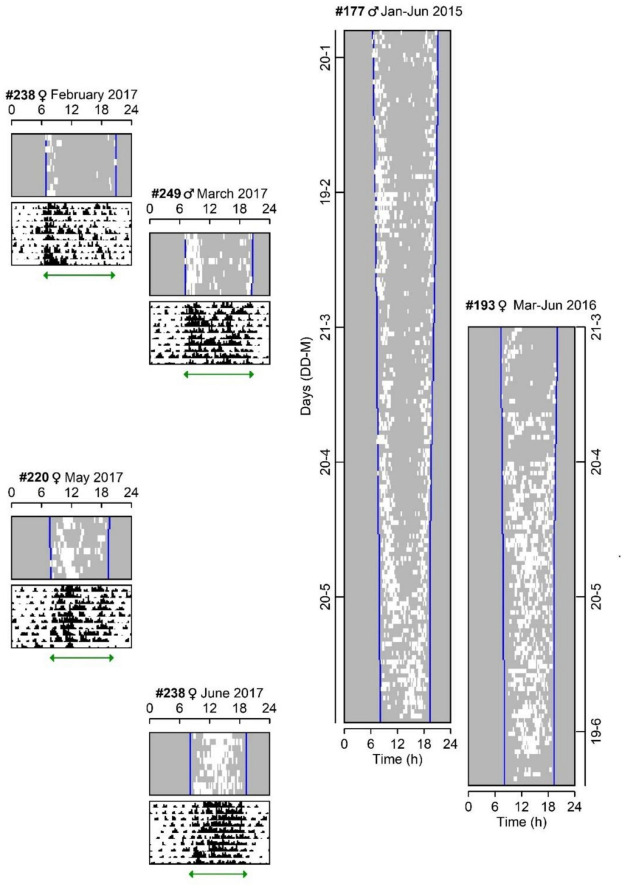
FIGURE 1.
Daily light exposure and activity patterns of individual tuco-tucos released in semi-natural enclosures from summer to winter. Actograms are positioned according to the annual timescale. The duration of the recordings was different for each animal. Left: Four shorter recordings (10 days), from individuals released in the enclosures throughout 2017, showing light exposure (white marks) and simultaneously recorded general activity (black marks). Green horizontal arrows indicate field-activity duration of each animal—#238 (Feb): 13.8 ± 1.7 h; #249 (Mar): 14.1 ± 0.8 h; #220 (May): 12.3 ± 0.5 h; #238 (Jun): 11 ± 0.5 h. Summer and winter field-activity durations were statistically different (n = 6, Student’s t-test p = 0.02). Right: Two individuals with long term recordings of light exposure (white marks)—#177 from January to June 2015 and #193 from March to June 2016. Light exposure records indicate the time of surface emergences during sunlight hours (between civil twilight limits—blue vertical lines). Data of animals #177, #193, #220, #238 were taken from Jannetti et al. (2019).

