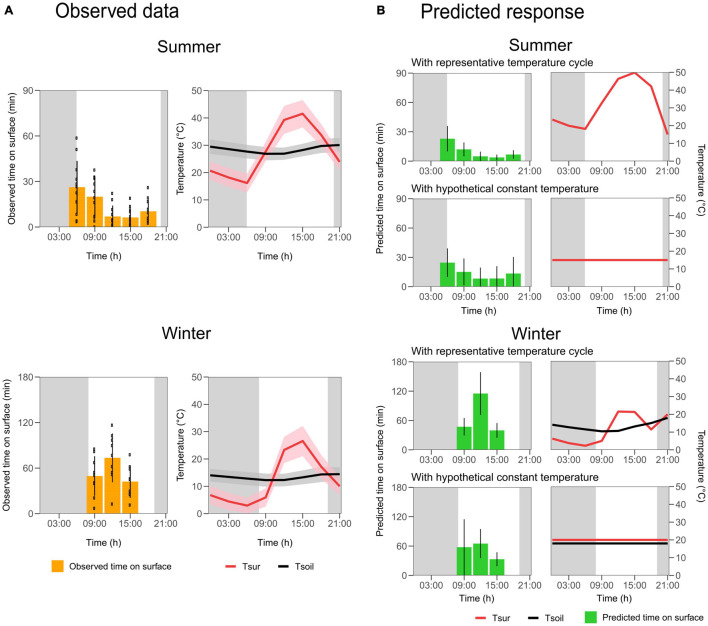
FIGURE 2.
Observed and predicted time tuco-tucos spent on the surface during the light hours of the day, in summer and winter. (A) Left: Observed time spent on surface according to collar light-logger data. Means by animal (black points) for every 3 h were averaged to obtain the overall pattern (yellow bars). Right: Mean and standard deviation (lines and shaded areas) of Tsur (red) and Tsoil (black) every 3 h, during animals’ recordings. (B) Predicted overall pattern of time on surface (green bars) according to the final generalized linear models fitted for summer (above) and winter data (below) assuming two different scenarios: representative natural temperature variation and hypothetical constant temperatures. Vertical lines in the bars: standard deviation of the predictions for each individual. Tsur (red lines) and Tsoil (black lines) used for predictions are shown to the right of the corresponding graph. Tsoil is not shown for summer since this variable was not significant in the model.

