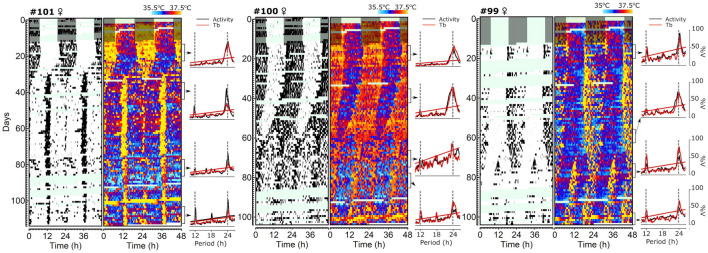
FIGURE 4.
Splitting of wheel running and body temperature rhythms in tuco-tucos under constant light conditions. Three panels depicting data from representative individuals: Animal #101 (left), Animal #100 (middle), and Animal #99 (right). In each panel, the left double-plotted actogram depicts wheel running (black bars indicate when running was recorded) and the actogram to the right depicts body temperature (a color gradient is used to display temperature values, maximum and minimum values are indicated in the legend above the graph). Areas shaded in gray indicate the dark phase of the LD cycle which preceded constant light. Areas shaded in light green indicate missing data. Graphs to the right of actograms depict results of the chi-square periodograms (Sokolove and Bushell, 1978) for wheel running (black) and temperature (red) calculated for the data corresponding to the intervals indicated by the arrows and brackets. Values are shown as spectral power (percentage of variance) as a function of the period tested (5-min steps were used). Inclined lines in the periodograms indicate the significance thresholds (p < 0.05). 24-h and 12-h periods are emphasized by the dashed vertical gray lines for reference.

