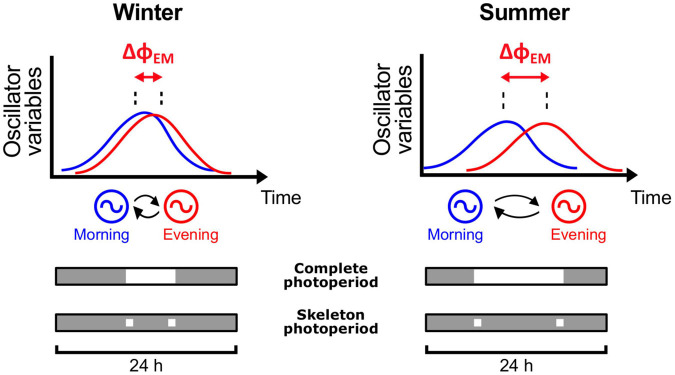
FIGURE 5.
Schematic representation of the two-oscillator model of the circadian clock and its role in photoperiod encoding. The model proposed by Pittendrigh and Daan (1976c) consists of a morning (M) oscillator that tracks dawn and an evening (E) oscillator that tracks dusk. M and E (circles) are coupled to each other (curved arrows). In the upper graphs, blue and red curves represent the state variables of M and E, respectively. As the photoperiod changes from short days in winter to long days in summer, there is a change in the phase relationship between E and M (ΔΦEM, red horizontal arrows), which modifies the state of the circadian clock. Below the graphs, gray/white bars represent the light/dark times of the LD cycles. Upper bars indicate an LD cycle with complete photoperiod, i.e., light occurring during the complete photophase. Lower bars represent skeleton photoperiods, a simplified experimental protocol that reproduces the effects of photoperiod with only two light pulses, applied at the twilights.

