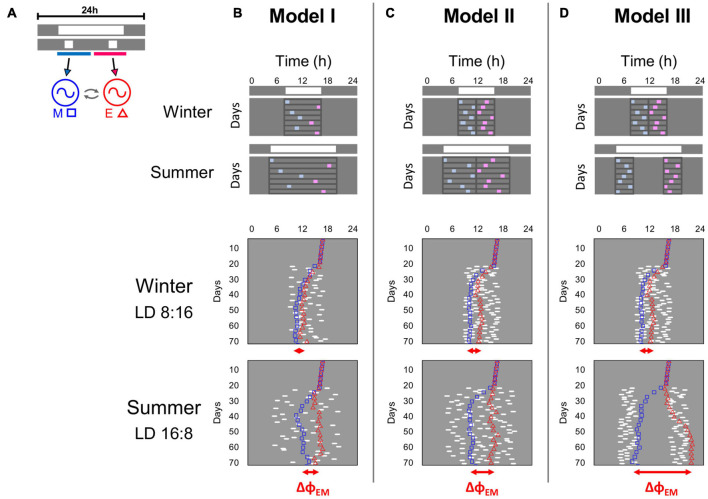
FIGURE 6.
A mathematical model was used to simulate 3 scenarios of light exposure at different seasons, and their impact on the synchronization of a two-oscillator model of the circadian clock. (A) Morning (M) and Evening (E) oscillators (circles), mutually coupled (curved arrows), were exposed to daily light pulses at random times within the photophase. The 24 h light regimen is represented by gray (dark) and white (light) bars. Upper bar: complete photoperiod. Lower bar: light exposure episodes (light pulses). Pulses between light onset and midday were applied to M (blue line and arrow), and pulses from midday to light offset were applied to E (pink line and arrow). (B–D)—Light exposure models I, II, and III, in winter and summer photoperiods. Upper panels: Schemes of the light pulse schedules. Gray/white bars depict the complete photoperiods and conceptual schemes represent the light exposure episodes along consecutive days, with blue and pink squares indicating light pulses applied to M and E, respectively. Lines around the light pulses on each day delimit the distribution interval of the pulses. Lower panels: Actograms illustrate the model dynamics on consecutive days under the light pulses (white marks). Colored symbols depict the reference phases of M (blue squares) and E (red triangles). Oscillator symbols are plotted only every third day for better visualization. Below the actograms, red horizontal arrows show the average ΔΦEM on the last 20 days. For details on the light exposure models, see main text. For model parameters see section “Materials and Methods.”

