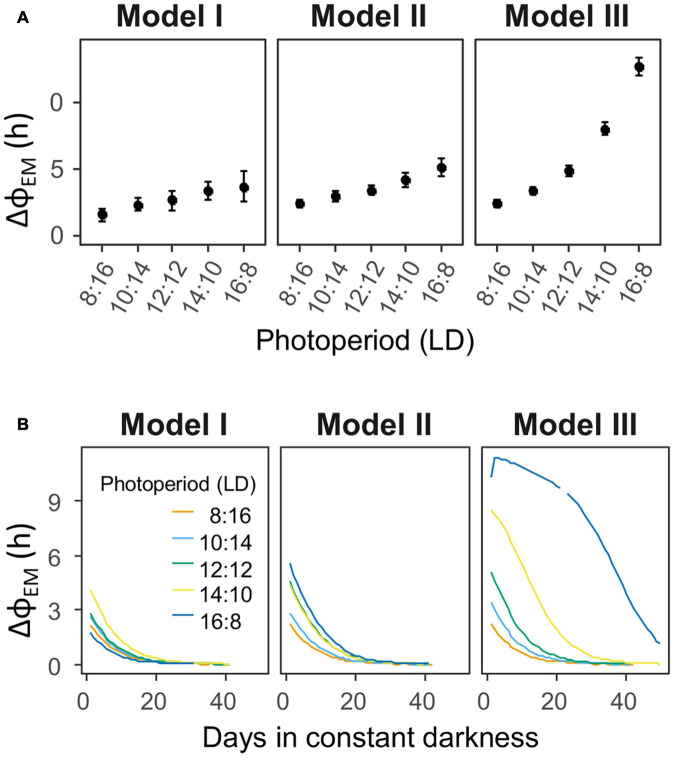
FIGURE 7.
Quantifications of the phase relationships between E and M (ΔΦEM) in the 3 models, during the light exposure, and afterward in constant conditions. (A) Average ΔΦEM in the last 20 days of light pulses, under different photoperiods. (B) Progression of ΔΦEM along the days in constant conditions (DD), after termination of the pulses. The initial values in constant conditions reveal aftereffects of the previous entrainment to the distinct photoperiods.

