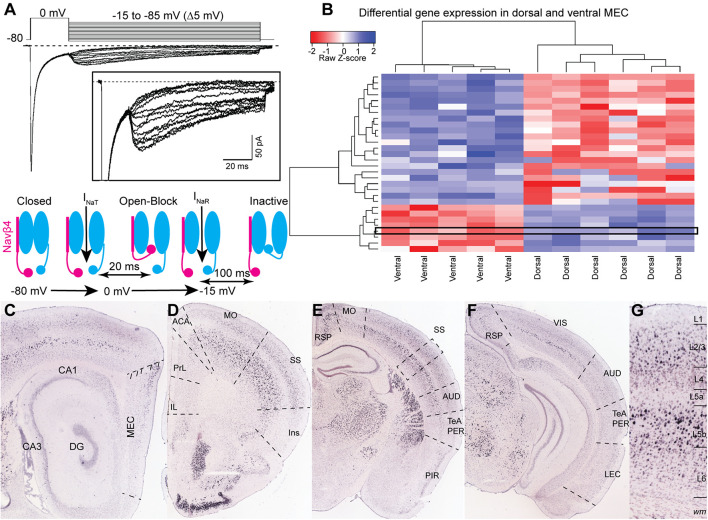
FIGURE 1.
(A) Representative voltage-clamp recording of sodium currents in a layer II neuron in MEC. Sodium currents were evoked by the voltage steps shown in the upper panel. A 20 ms step to 0 mV evoked INaT and was followed by a family of repolarizing steps from –15 to –85 mV to elicit INaR. Insert shows an expanded view of the INaR. The schematic in the lower panel shows the sequence of events generating INaR in sodium channels associated with a Navβ4 subunit. (B) Differentially expressed gene analysis of data from Ramsden et al. (2015). Gene expression driven separation between ventral and dorsal medial entorhinal cortex from P60 mice. Scn4b is highlighted by a black rectangle and appears as one of 8 genes significantly enriched in the dorsal adult MEC. Heatmap displays 34 genes significantly up or downregulated in either ventral or dorsal MEC samples (p-val. < 0.05, log2FC threshold ± 1.5, Benjamini-Hochberg corrected; hierarchical clustering performed by pairwise-Spearman correlation matrix). (C–G) ISH experiments from the Allen Institute showing the expression of scn4b across the cerebral cortex. (C) Scn4b is expressed in the dorsal MEC. (D–F) Expression of scn4b in the isocortex decreases from rostral (C) to caudal (F) regions. (G) Magnification of the somatosensory (SS) area highlighted by a dotted box in (C). CA, Cornu Ammonis; DG, dentate gyrus; MEC, medial entorhinal cortex; IL, infralimbic; PrL, prelimbic; ACA, anterior cingulate area; MO, motor area; SS, somatosensory area; Ins, insula; AUD, auditory area; TeA, temporal association area; PER, perirhinal cortex; PIR, piriform cortex; RSP, retrosplenial area; VIS, visual area; LEC, lateral entorhinal cortex. Image credit: For (A): adapted from Nigro et al. (2012) with permission from Elsevier. For (C–G) Allen Institute. 2004 Allen Institute for Brain Science. Allen Mouse Brain Atlas. Available from: https://mouse.brain-map.org/.

