Figure 1.
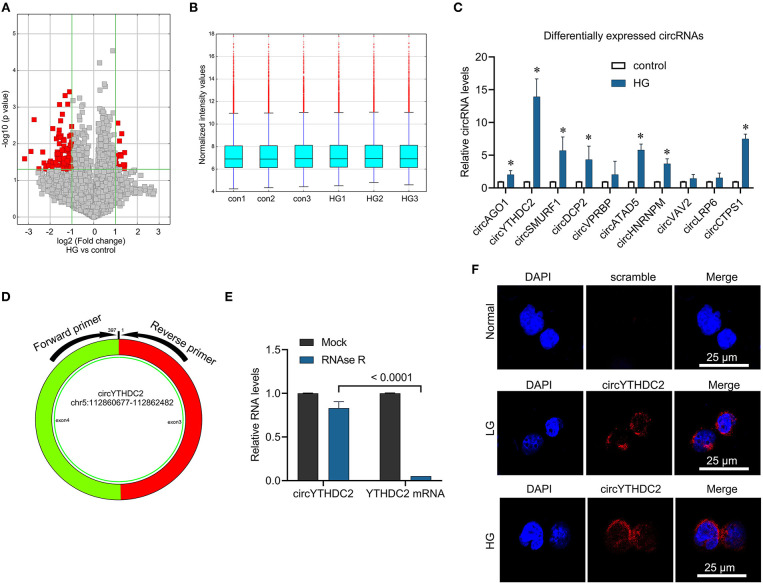
Microarray analysis reveals the aberrantly expressed circRNA in the high glucose-Induced VSMCs. (A) Volcano plot presents the differently expressed circular RNAs (fold change > 2, p-value < 0.05) in VSMCs treated with high glucose (HG) and control. (B) The normalization of differently expressed circular RNAs. (C) A7R5 cells were treated with high glucose (25 mmol/L) for 24 h. The cells treated with 5 mmol glucose were used as control. qRT-PCR was performed for verifying the top ten upregulated circRNAs in microarray analysis. *p < 0.05. (D) The circYTHDC2 structure and the location of divergent primers for circYTHDC2 was shown. (E) qRT–PCR analysis for the expression of circYTHDC2 and YTHDC2 mRNA after treatment with RNase R in A7R5 cells. (F) The representative images of RNA fluorescence in situ hybridization for circYTHDC2. circYTHDC2 was stained with red, nuclei were stained with DAPI. Bar, 25 μm. Three independent studies were performed and the data were expressed as mean ± standard deviation.

