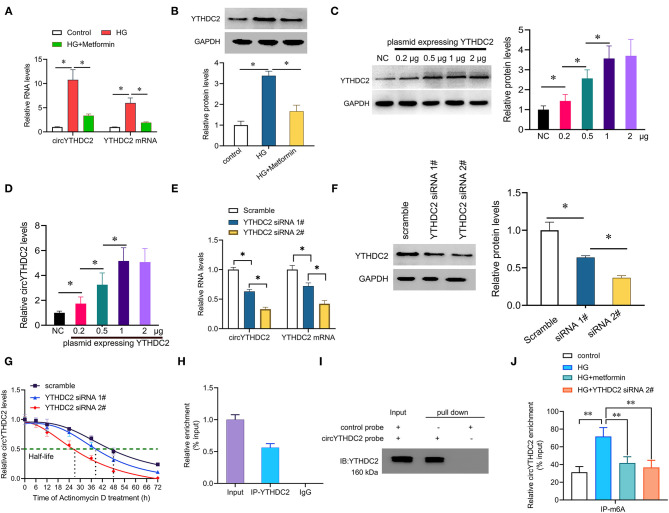
Figure 3.
YTHDC2 stabilizes circYTHDC2 by m6A modification. (A) qRT–PCR analysis for the expression of circYTHDC2 and YTHDC2 after treatment with high glucose (HG) alone, or together with metformin in A7R5 cells. (B) western blot analysis for the expression of YTHDC2 after treatment with high glucose (HG) alone, or together with metformin in A7R5 cells. (C) A7R5 cells were transfected with increased plasmids expressing YTHDC2, and western blot was performed to determine the expression of YTHDC2. (D) qRT–PCR analysis for the expression of circYTHDC2 after transfection with increased plasmids expressing YTHDC2 in A7R5 cells. (E) qRT–PCR analysis for the expression of circYTHDC2 and YTHDC2 mRNA after YTHDC2 siRNA transfection in A7R5 cells. (F) western blot was performed to determine the expression of YTHDC2 after YTHDC2 siRNA transfection in A7R5 cells. (G) qRT–PCR analysis for the expression of circYTHDC2 after treatment with Actinomycin D at the indicated time points in A7R5 cells transfected with YTHDC2 siRNA. (H) RIP assays showing the association of YTHDC2 with circYTHDC2 in A7R5 cells. Relative enrichment representing RNA levels associated with YTHDC2 relative to an input control. IgG antibody served as a control. (I) The circYTHDC2-protein complex pulled down by circYTHDC2 junction probe with protein extracts from A7R5 cells. Immunoblot analysis of YTHDC2 after pulldown assay showing its specific association with circYTHDC2. (J) RIP assays showing the association of m6A with circYTHDC2 in VSMCs after treatment with high glucose (HG) alone, or together with metformin or YTHDC2 siRNA transfection. Three independent studies were performed and the data were expressed as mean ± standard deviation. *p < 0.05, **p < 0.01.

