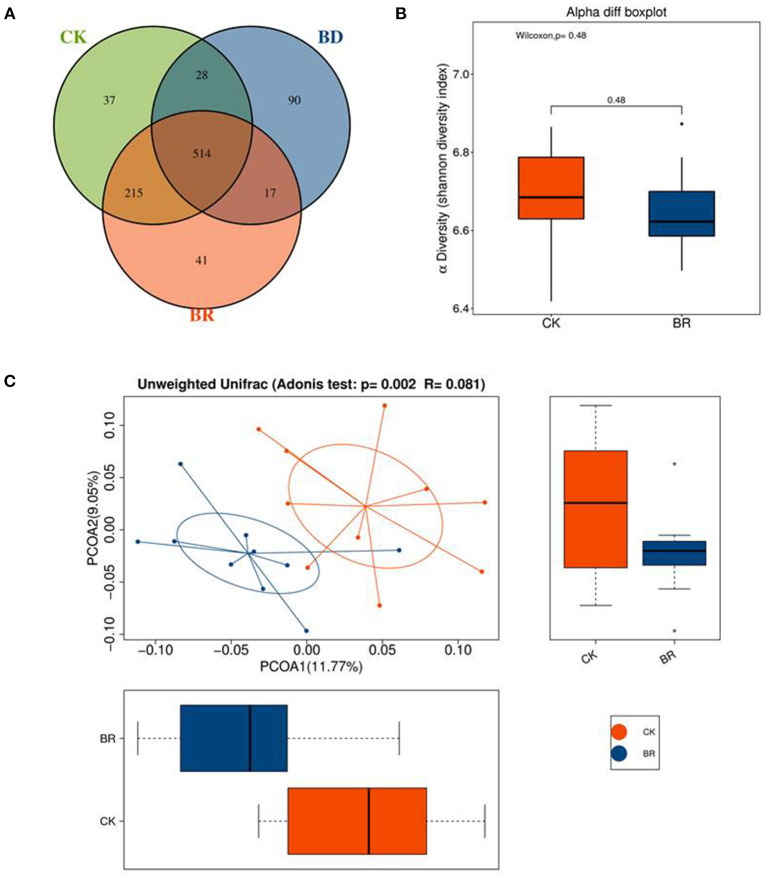
Figure 4.
(A) The Venn diagram; different color represents different group. The interior of each circle symbolically represents the number of operational taxonomic units (OTUs) in a certain group; the overlapping area represents the set of common OTUs in the counterpart groups; the single-layer zone represents the unique OTUs in a certain group. (B) Shannon diversity. (C) Principal coordinate analysis (PCoA); the abscissa represents the first principal coordinate, the percentage in brackets represents the contribution rate of the first principal coordinate to the sample difference, the ordinate represents the second principal coordinate, and the percentage in brackets represents the contribution rate of the second principal coordinate to the sample difference. CK, check, n = 10; BR, broiler recipient, n = 10; BD, broiler donor, a pooled sample of N = 1.

