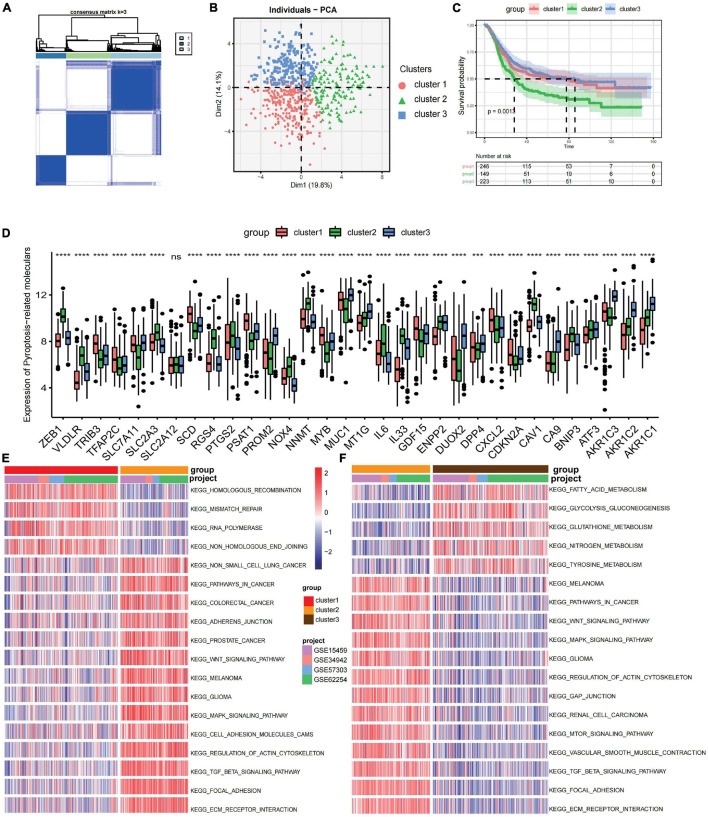
FIGURE 1.
Prognosis and biological characteristics of each ferroptosis-related subtype. (A) Consensus clustering matrix for k = 2. (B) Principal component analysis for the transcriptome profiles of three ferroptosis-related subtypes. (C) Kaplan–Meier analysis of patients in the three different ferroptosis-related subtypes. (D) Expression profiles of 32 ferroptosis-related genes in three subtypes. ns, no significance. ***p < 0.001; ****p < 0.0001, as determined by the Kruskal–Wallis test. (E,F) Enrichment degree of biological pathways in the different ferroptosis-related subtypes shown in a heatmap: cluster 1 vs. cluster 2 (E) and cluster 2 vs. cluster 3 (F).

