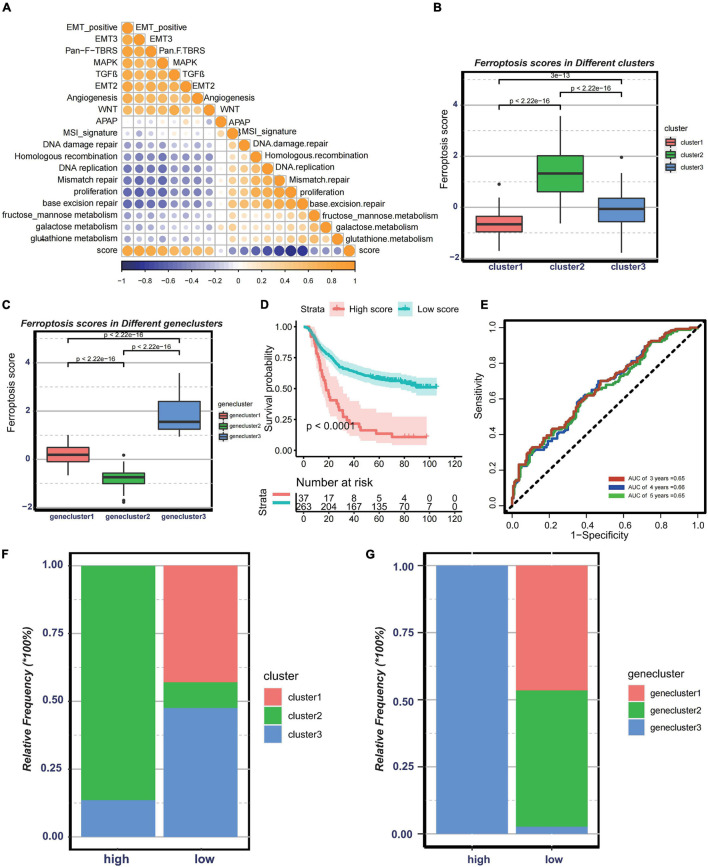
FIGURE 5.
Construction of ferroptosis gene signatures. (A) Correlation between known gene signatures related to gastric cancer and the ferroptosis score. (B) Differences in the ferroptosis scores among three distinct clusters. (C) Differences in the ferroptosis scores among three distinct gene clusters. (D) Kaplan–Meier analysis of patients with low or high ferroptosis scores. (E) Prognostic value of the ferroptosis score in the Asian Cancer Research Group (ACRG) cohort. (F) Relative frequency of clusters in patients with low or high ferroptosis scores in the ACRG cohort. (G) Relative frequency of gene clusters in patients with low or high ferroptosis scores in the ACRG cohort.

