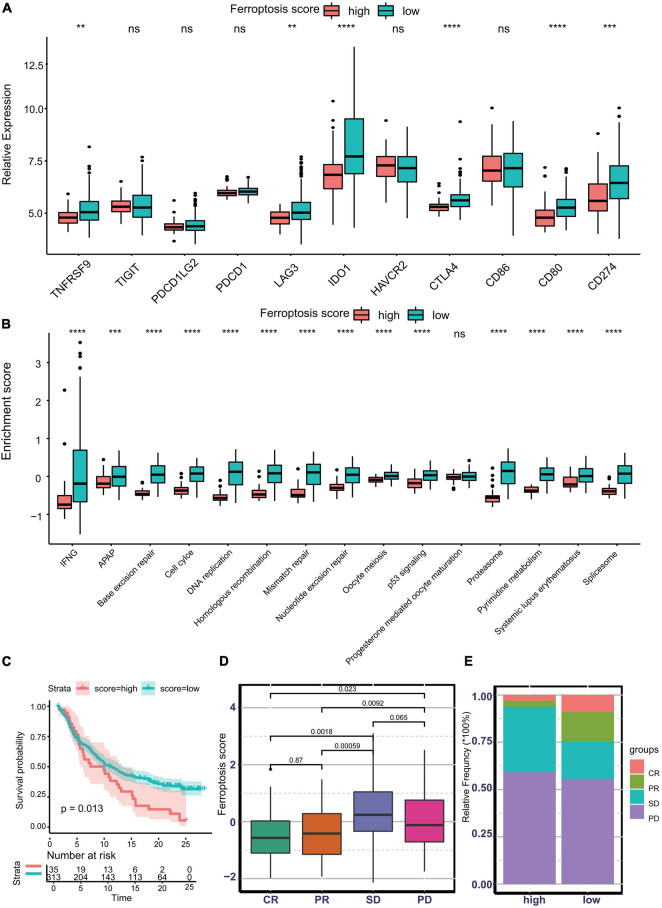
FIGURE 7.
Predictive value of the ferroptosis score for response to immunotherapy. (A) Different expression profiles of immune checkpoint-related genes in patients with low or high ferroptosis scores in the Asian Cancer Research Group (ACRG) cohort (**p < 0.01; ***p < 0.001; ****p < 0.0001). ns, no significance. (B) Different activation status of immunotherapy-positive gene signatures in patients with low or high ferroptosis scores in the ACRG cohort (***p < 0.001; ****p < 0.0001). ns, no significance. (C) Kaplan–Meier curves showing overall survival in patients with low or high ferroptosis scores in the immunotherapy cohort. (D) Distribution of the ferroptosis scores in distinct anti-PD-L1 clinical response groups. (E) Relative frequency of each anti-PD-L1 clinical response group in groups with low or high ferroptosis scores.

