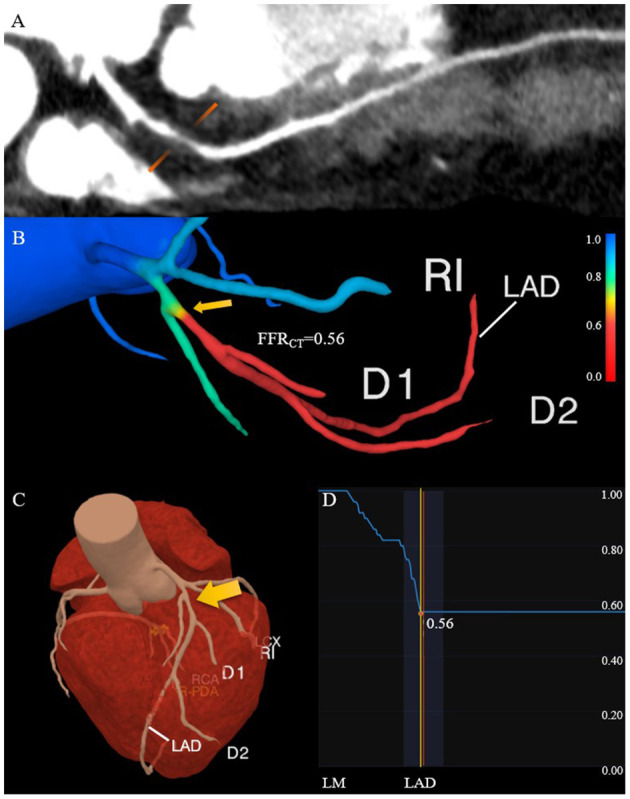
Figure 3.

Comprehensive assessment of the characteristics of high-risk plaque with CCTA. (A) The lesion in the proximal of the left anterior descending coronary artery has positive remodeling and low attenuation. (B) The FFRCT map derived from computational fluid dynamics shows a value of 0.56 distal to the stenosis, which indicates lesion ischemia. The transition from blue to red along the left anterior descending coronary artery indicates the decreasing trend of the FFRCT. (C) The 3D model diagram of the coronary artery, and the yellow arrow indicates the location of the high-risk plaque. (D) The curve of the FFRCT value from the proximal to distal of the left anterior descending branch. CCTA, coronary computed tomography angiography; FFRCT, fractional flow reserve derived from CCTA.
