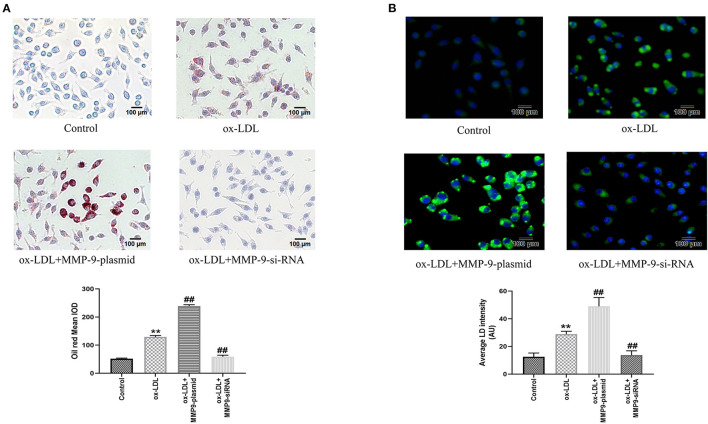
Figure 4.
Oil Red O and BODIPY 493/503 staining after MMP-9-plasmid and MMP-9-siRNA transfections. (A) THP-1 macrophage cells were transfected before incubation with ox-LDL for 24 h and stained with Oil Red O (× 200, 100 μm), the intracellular lipid droplets of the mean optical density value (mean IOD) were used to reflect the degree of cellular foam. (B) Lipid droplets were labeled with green fluorescence and the nuclei were labeled with DAPI (blue) (× 200, 200 μm), average LD intensity was used to quantify lipid uptake. Data are presented as the mean ± SD, n = 6. Compared with the control group, **P < 0.01; compared with the ox-LDL group, ##p < 0.01.

