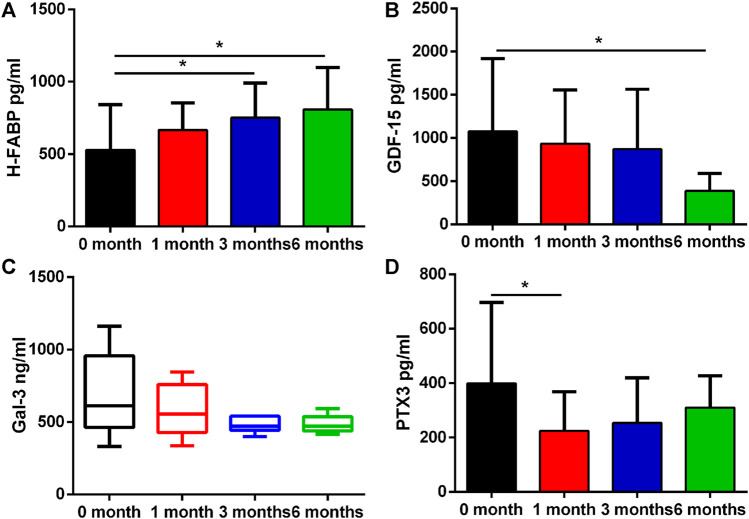
FIGURE 2.
Proteins that had differential plasma levels between baseline and 1, 3 and 6 months. Edges of boxes denote 25th and 75th percentiles, lines are median concentrations, and error bars are minimum and maximum concentrations. (A) NT-pro BNP: N-terminal pro–B-type natriuretic peptide; (B) D-dimer; (C) CK: creatine kinase; (D) CK-MB: creatine kinase-MB.

