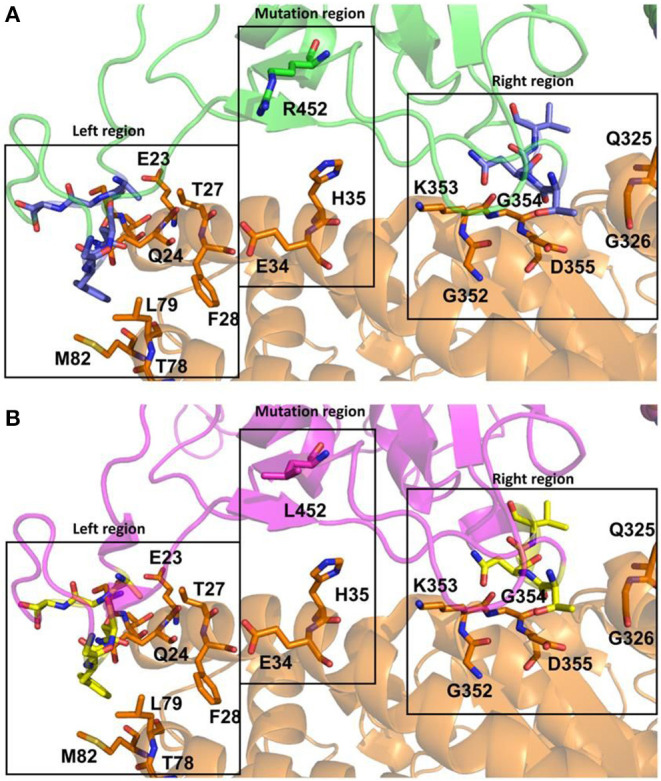
Figure 6.

The interaction regions between the SARS-CoV-2 Spike proteins and the ACE2 receptor (ribbons and sticks in orange). (A). SARS-CoV-2 Spike protein for the P.4 lineage (in silico model) is highlighted in green (ribbons and sticks, including the mutated residue), with important conserved residues in slate (sticks). (B). SARS-CoV-2 Spike protein for the Wuhan glycoprotein (cryo-EM structure) is highlighted in magenta (ribbon and sticks, including the mutated residue), with important conserved residues in yellow (sticks). For all atoms presented in sticks, carbon atoms are shown in orange (ACE2) or green/slate/magenta/yellow (Spike proteins), nitrogen atoms are shown in blue, oxygen atoms are shown in red and all hydrogen atoms are omitted for clarity. The figure was generated using PyMol software.
