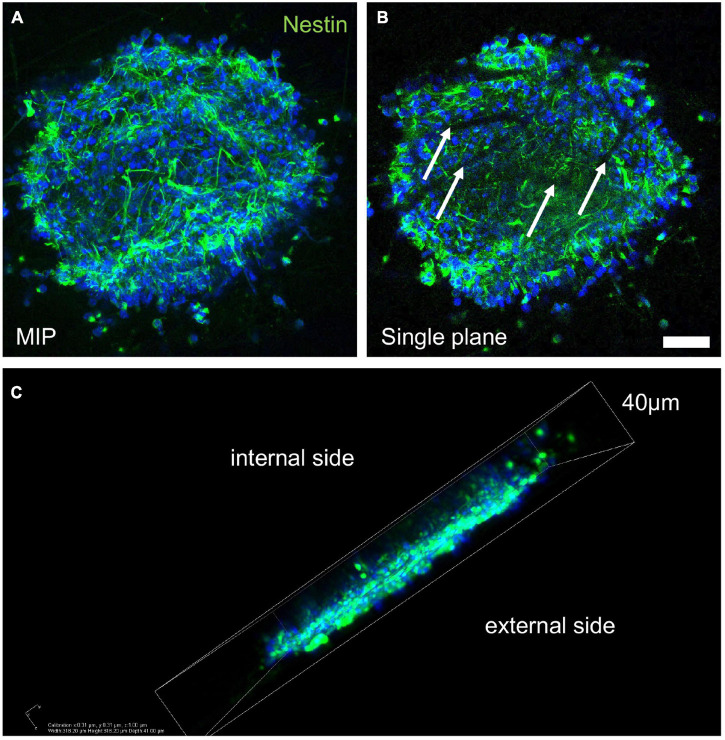
FIGURE 2.
Sphere integration into the three-dimensional PBT scaffold. (A–C) Representative images of confocal z-stack derived maximum intensity projection (MIP; A), single plane picture (B), and 3D reconstruction (C) of a secondary neurosphere seeded in VITVO and stained by immunocytochemistry for nestin marker, after 3 days in culture. White arrows in B indicate the PBT fibers. Scale bar (A,B) 30 μm.

