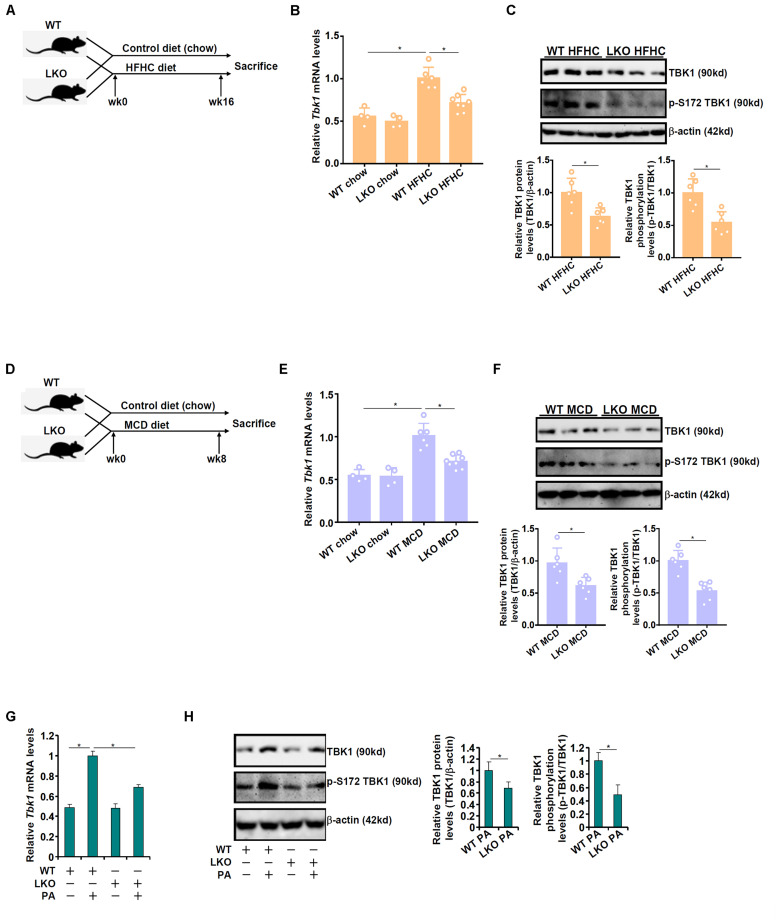
FIGURE 1.
BRG1 deletion down-regulates TBK1 expression. (A–C) WT and BRG1LKO mice were fed an HFHC diet or a chow diet for 16 weeks. (A) A flow chart of animal protocol. TBK1 expression in the liver was examined by qPCR (B) and Western (C). Each lane represents a sample extracted from an individual mouse. N = 4 mice for the chow groups and N = 6 mice for the HFHC groups. *p < 0.05. (one-way ANOVA with post hoc Scheffe test for qPCR quantification and two-tailed student’s t-test for Western quantification). (D–F) WT and BRG1LKO mice were fed an MCD diet or a chow diet for 8 weeks. (D) A flow chart of animal protocol. TBK1 expression in the liver was examined by qPCR (E) and Western (F). Each lane represents a sample extracted from an individual mouse. N = 4 mice for the chow groups and N = 6 mice for the MCD groups. *p < 0.05 (one-way ANOVA with post hoc Scheffe test for qPCR quantification and two-tailed student’s t-test for Western quantification). (G,H) Primary hepatocytes were isolated from WT and BRG1LKO mice and treated with palmitate (PA, 0.4 mM) for 12 h. TBK1 expression was examined by qPCR and Western. *p < 0.05 (one-way ANOVA with post hoc Scheffe test). Data are expressed as mean ± standard deviation (SD). All experiments were performed in triplicate wells and repeated three times. One representative experiment is shown.

