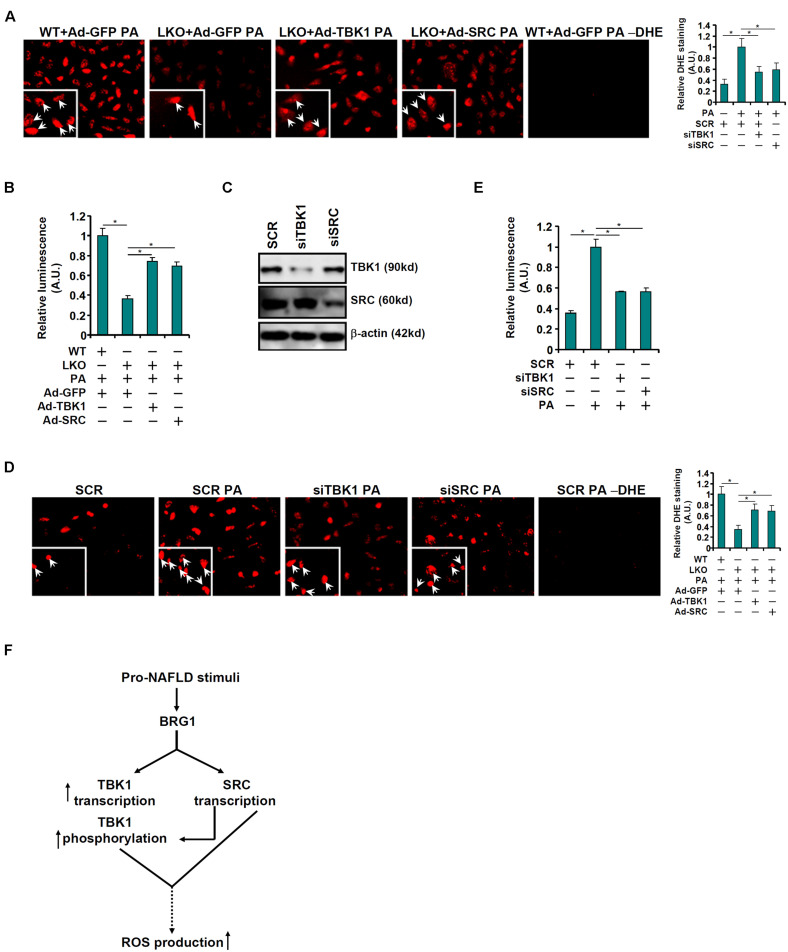
FIGURE 5.
TBK1 and c-SRC contribute to PA induced ROS production in hepatocytes. (A,B) Primary hepatocytes isolated from WT and BRG1LKO mice were transduced with indicated adenovirus followed by treatment with PA (0.4 mM). ROS levels were measured by DHE staining and luminescence assay. (C–E) Primary hepatocytes were transduced with indicated siRNAs followed by treatment with PA (0.4 mM). Knockdown efficiencies were examined by Western. ROS levels were measured by DHE staining and luminescence assay. *p < 0.05 (one-way ANOVA with post hoc Scheffe test). Data are expressed as mean ± standard deviation (SD). All experiments were performed in triplicate wells and repeated three times. One representative experiment is shown. (F) A schematic model.

