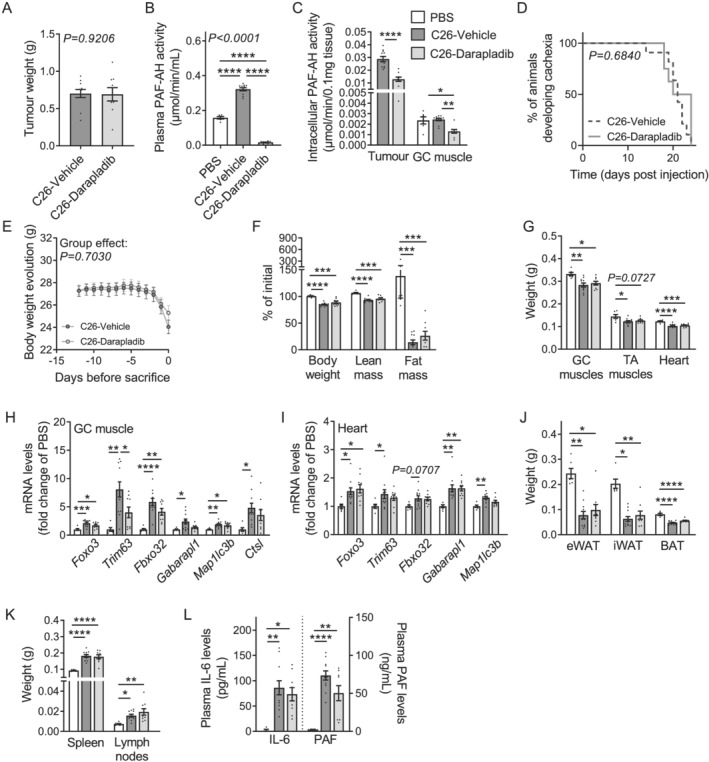
Figure 3.

Darapladib treatment was not sufficient to counteract CCx in C26 tumour‐bearing mice despite a strong inhibition of PLA2G7 activity. (A–L) Mice were injected subcutaneously either with PBS (control mice) or C26 cancer cells and treated once daily either with vehicle (PBS mice, white bars, n = 6 animals; C26‐vehicle tumour‐bearing mice, dark grey bars/lines, n = 11 animals) or 50 mg/kg darapladib (C26‐darapladib tumour‐bearing mice, light grey bars/lines, n = 9 animals). (A) Tumour weights. (B) PAF‐AH activity in plasma, (C) tumours and GC muscles. (D) Kaplan–Meier curve depicting the percentage of mice developing cachexia over time. (E) Kinetic of body weight loss during days prior sacrifice. (F) Loss of body weight, and lean and fat mass (expressed as percentage of initial mass). (G) GC muscles, TA muscles, and heart weights. (H) mRNA levels of atrophy and autophagy markers in GC muscle and (I) heart. (J) Epididymal (eWAT), inguinal (iWAT), and brown (BAT) adipose tissues weights. (K) Spleen and lymph nodes weights. (L) Plasma interleukin‐6 (IL‐6) and platelet‐activating factor (PAF) levels (n = 5 PBS animals, n = 11 C26‐shCTR animals, and n = 9 C26‐shPla2g7 animals). Data are mean ± standard error of the mean. Statistical analyses were performed using unpaired t‐test (A, C), unpaired one‐way ANOVA or Kruskal Wallis with Bonferroni or Dunn's post hoc tests, respectively (B, C, F–L), paired two‐way ANOVA (E), and log‐rank (Mantel–Cox) test (D). Tests were two sided. *P < 0.05, **P < 0.01, ***P < 0.001, and ****P < 0.0001.
