Figure 4.

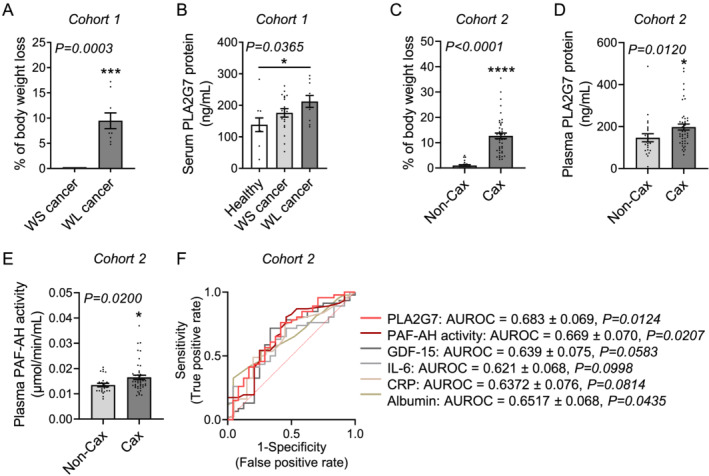
Circulating PLA2G7 levels are higher in weight‐losing cancer patients. (A) Percentage of body weight loss in the past 3 months and (B) PLA2G7 protein levels in serum of healthy individuals (white bar, n = 10 individuals) and weight‐stable (WS, light grey bars, n = 19 individuals) and weight‐losing (WL, dark grey bars, n = 10 individuals) patients with pancreatic or colorectal cancer. (C) Percentage of body weight loss, (D) plasma PLA2G7 protein, and (E) plasma PAF‐AH activity levels in non‐cachectic (Non‐Cax, light grey bars, n = 24 individuals) and cachectic (Cax, dark grey bars, n = 46 individuals) patients with pancreatic cancer. (F) Receiver operating characteristic (ROC) curve analysis, which measures the potential of circulating PLA2G7 protein, PAF‐AH activity, growth differentiation factor 15 (GDF‐15), interleukin‐6 (IL‐6), C‐reactive protein (CRP), or albumin levels to discriminate between cachectic and non‐cachectic cancer patients from Cohort 2 based on their sensitivity (true positive rate) and specificity (false positive rate: 1 − specificity). The area under the ROC curve (AUROC) and its associated P value illustrate the strength of a factor to distinguish between the two groups of patients. Data are mean ± standard error of the mean. Statistical analyses were performed using unpaired t‐test (A), Mann–Whitney test (C–E), and unpaired one‐way ANOVA with Bonferroni post hoc tests (B). ROC curve analysis (F) was performed using GraphPad Prism 8.4. Tests were two sided. *P < 0.05, ***P < 0.001, and ****P < 0.0001.
