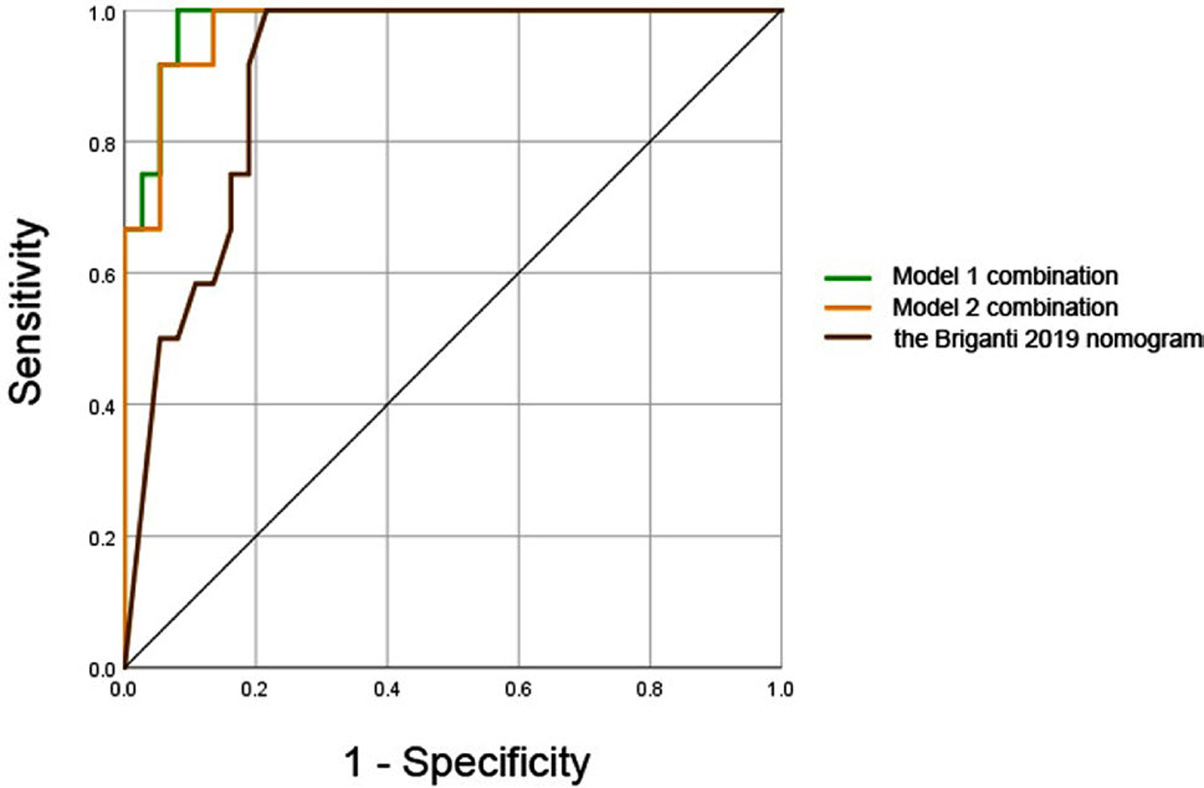
Fig. 6.

Receiver operating characteristic (ROC) curves of multivariate model 1 (combination of PCa stiffness at 60 Hz and maximum diameter of PCa), model 2 (combination of PCa stiffness at 90 Hz and maximum diameter of PCa), and the probability of predicted value (calculated by the Briganti 2019 nomogram) for predicting lymph node metastasis. The areas under the curves (AUCs) of them were 0.982, 0.975, and 0.904, respectively (model 1 vs. model 2, P = 0.383; model 1 vs. the Briganti 2019 nomogram, P = 0.040; model 2 vs. the Briganti 2019 nomogram, P = 0.060)
