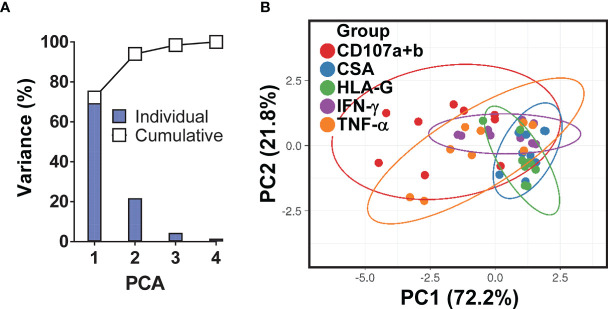
Figure 4.
Principal Component (PC) Analysis variances. (A) The percent variations are plotted for each component (bars) and cumulatively (line). (B) Ability of PCA to cluster the levels of HLA-G and S. Typhi antigen (CSA) expression on B-LCLs and production of IFN-γ and TNF-α cytokines and expression of CD107a & b by MAIT cells. Unit variance scaling is applied to rows; singular value decomposition (SVD) with imputation is used to calculate principal components. X and Y axis show PC1 and PC2 that explain 72.2% and 21.8% of the total variance, respectively. Prediction ellipses are such that with probability 0.95, a new observation from the same group will fall inside the ellipse. Each dot represents a single experimental condition and volunteer, where each PC summarizes the variance of 75 data points for 3 experimental conditions (MAIT cells exposed to uninfected, or S. Typhi-infected B-LCLs that were treated with a neutralizing mAb to HLA-G (HLA-G), or isotype control (ISO) in 5 individual experiments).

