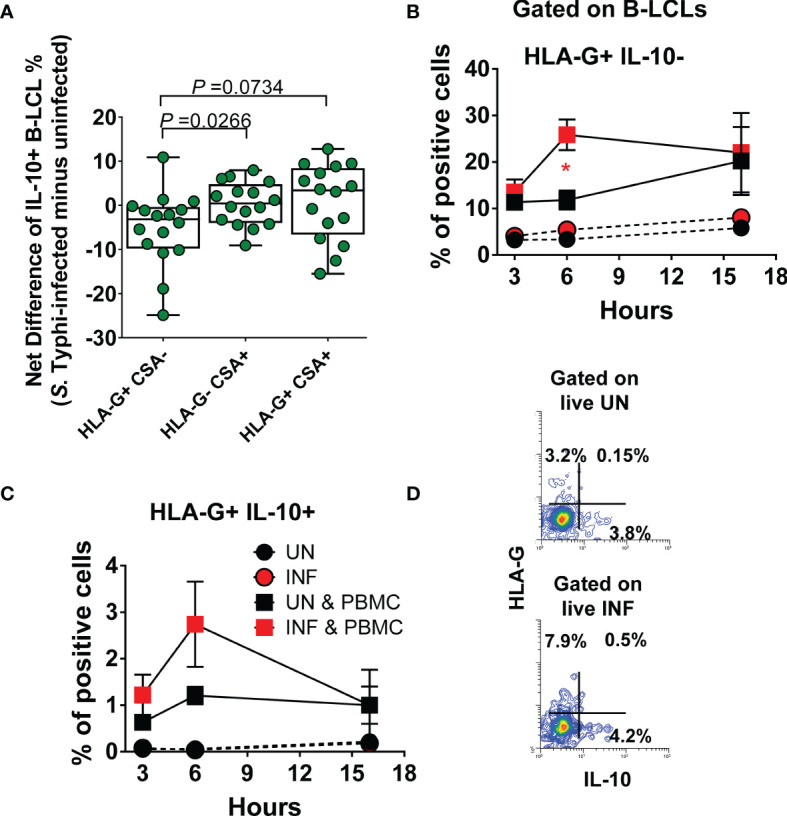
Figure 6.

Effect of S. Typhi infection on B cell function. B-LCLs were infected with S. Typhi for 3 hours at 1:10 multiplicity of infection (MOI). Uninfected cells were used as controls. After 16-18 hours of gentamicin treatment, cells were co-cultured with PBMC. After 3, 6 and 16 hours of co-culture, cells were collected, and the B cell expression of CSA, HLA-G, and IL-10 were evaluated by flow cytometry. (A) Levels of IL-10 among B-LCL subsets (i.e., HLA-G+ CSA-, HLA-G- CSA+, and HLA-G+ CSA+). Bar graphs extend from the 25th to 75th percentiles; the line in the middle represents the median of the pooled data. The whiskers delineate the smallest to the largest value. Kinetics of (B) HLA-G+ IL-10- and (C) HLA-G+ IL-10+ expression on UN and INF B-LCLs alone or after exposure to PBMC. For (B, C) and “C”, Student’s t-test was performed to compare B-LCL subset levels after exposure to PBMC. *, represent significant differences (P<0.05) between the UN ( ) and INF B-LCLs (
 ) in the presence of PBMC at the same timepoint. (D) A presentative experiment showing the expression of IL-10 on UN and INF B-LCLs.
