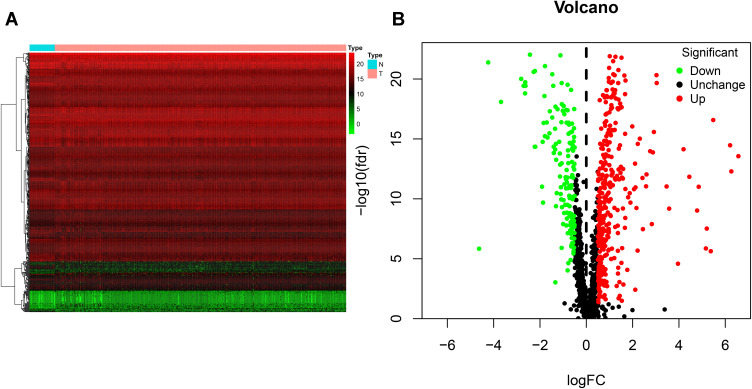
Figure 1.
Identification of differentially expressed RNA-binding proteins (DE RBPs) in The Cancer Genome Atlas (TCGA) dataset. (A) Heat map of the DE RBPs based on their log2-transformed fragments per kilobase of transcript per million mapped reads (FPKM) expression values. Red represents high expression, and green represents low expression. (B) Volcano plot of DE RBPs between colon adenocarcinoma (COAD) and normal colon tissue; 208 were upregulated, and 122 were downregulated. Red: upregulated RBPs; black: unchanged RBPs; green: downregulated RBPs.

