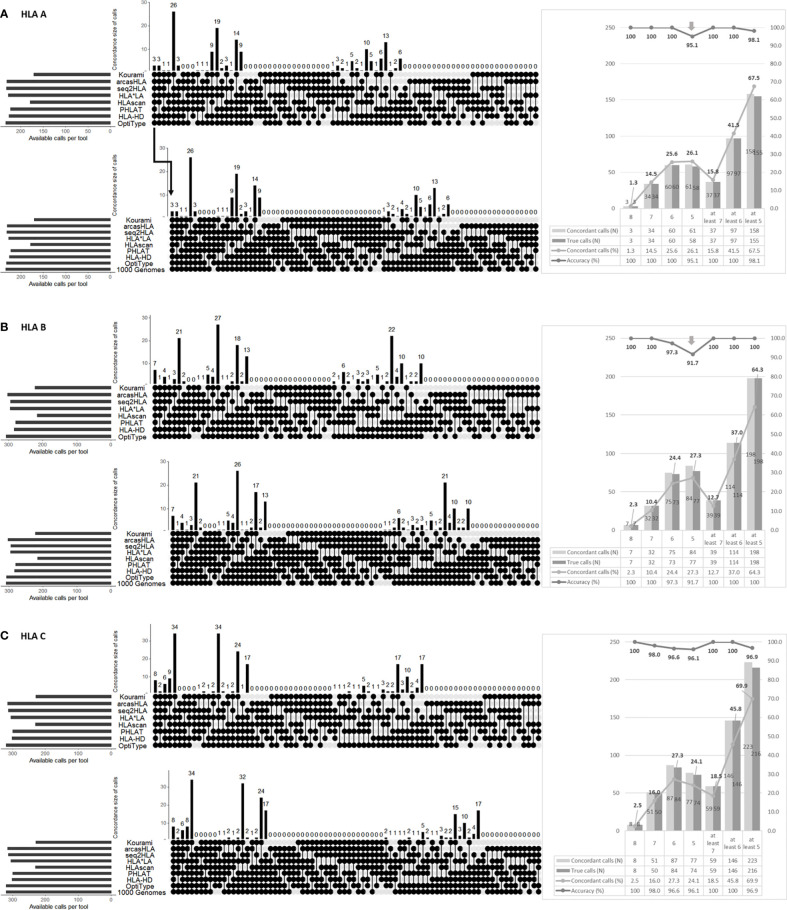
Figure 2.
Performance analysis of HLA genotyping by combining the eight tools in HLA-A (A), HLA-B (B), HLA-C (C). The upper part in each (A–C) shows the combinations of tools presenting the concordant calls. The round dots indicate the tools included in the combination. The number is the cases of each combination. The lower part in each (A–C) shows the accuracy of each combination. Each combination’s number in the lower part means that the concordant calls matched with the 1000 Genome Project data (i.e., “1000 Genome” points are additionally included in the combination). Therefore, the accuracy is the number of lower parts (the number of concordant calls matched with 1000 Genome Project data) divided by the number of upper parts (the number of concordant calls). The right part of each of (A–C) shows the number and percentage of concordant calls according to the number of matched calls regardless of the tool type and the number of true calls among these concordant calls and their percentage.

