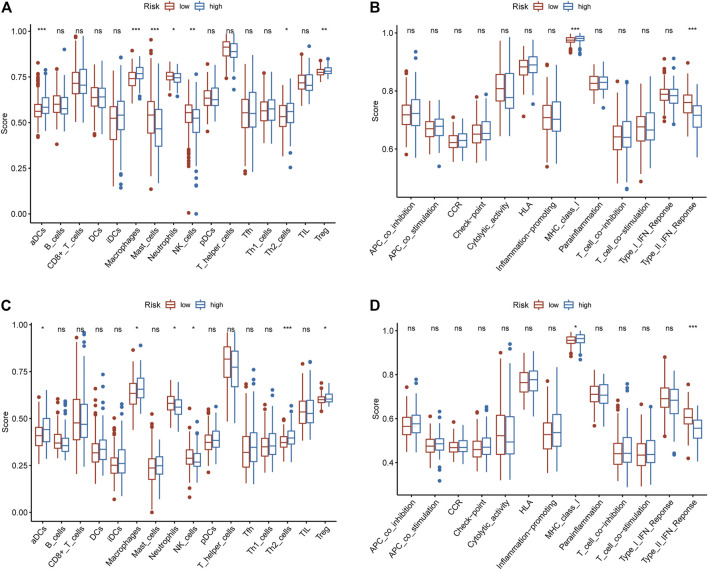
FIGURE 4.
The relationship between the IRGPs signature and immune infiltrating cells and immune-related functions. (A) The relationship between the IRGPs signature and immune cells in the TCGA cohort. (B) The relationship between the IRGPs signature and immune-related functions in the TCGA cohort. (C) The relationship between the IRGPs signature and immune cells in the ICGC cohort. (D) The relationship between the IRGPs signature and immune-related functions in the ICGC cohort. The adjusted p value is ns, which is not significant. *p < 0.05; **p < 0.01; ***p < 0.001.

