Figure 11.

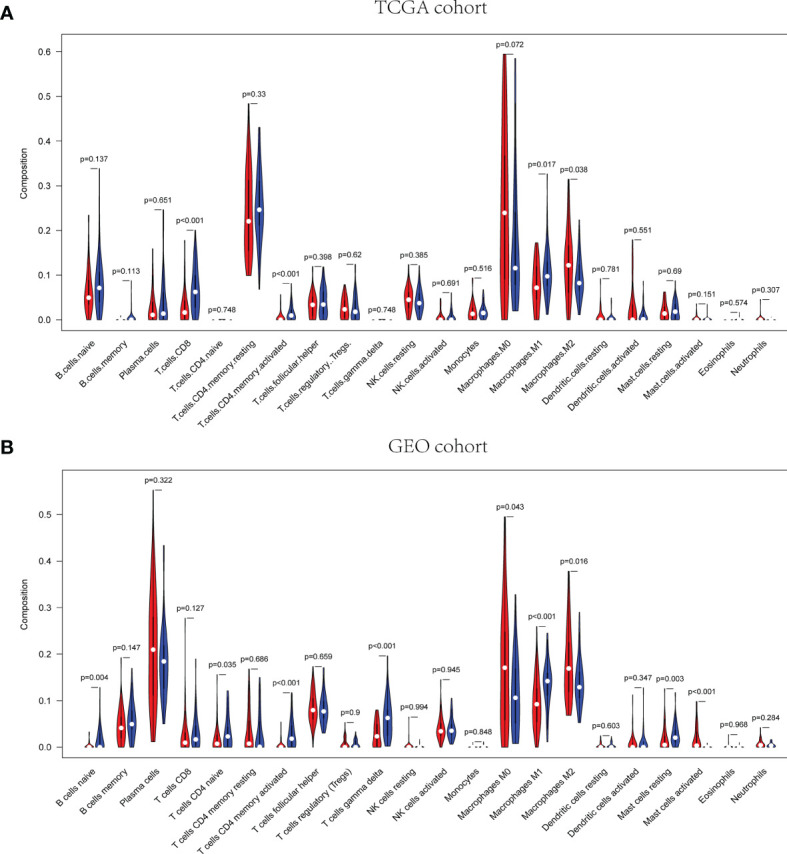
Correlation of distinct different immune cells between high- and low-risk groups in TCGA (A) and GEO (B), respectively.

Correlation of distinct different immune cells between high- and low-risk groups in TCGA (A) and GEO (B), respectively.