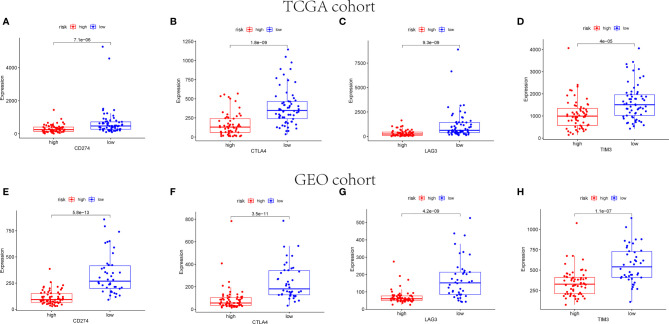
Figure 12.
Immune checkpoint gene expression levels in high- and low-risk groups. The expression levels of CD274 (A), CTLA4 (B), LAG3 (C), and TIM3 (D) in each group in TCGA cohort (p < 0.001). The expression levels of CD274 (E), CTLA4 (F), LAG3 (G), and TIM3 (H) in each group in GEO cohort (p < 0.001).

