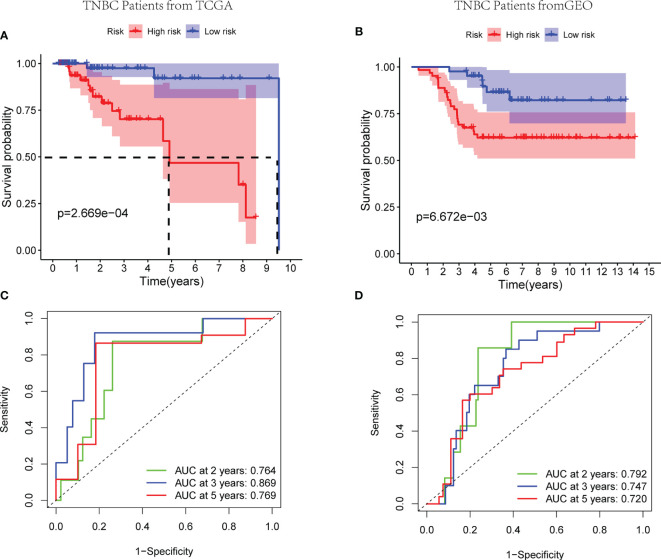
Figure 4.
Efficacy of the exosome risk model on prognosis of TNBC patients. (A, B) Kaplan-Meier survival curves for TNBC patients from TCGA and GEO databases, stratified according to risk scores (high vs. low). (A) The median survival time in high- and low-risk groups of TCGA cohort are 4.91 and 9.51 years, respectively; comparisons of the survival time in high- and low-risk groups with log-rank tests (p = 2.67E−04); the hazard ratio of TCGA cohort is 6.25; the 95% CI for high- and low-risk groups are presented as the red and blue shaded parts, respectively. (B) Patients in both the high- and low-risk groups of GEO cohort have not achieved median survival times; comparisons of the survival time in high- and low-risk groups with log-rank tests (p = 6.67E−03); the hazard ratio of GEO cohort is 3.24; the 95% CI for high- and low-risk groups are presented as the red and blue shaded parts, respectively. (C, D) ROC curve analysis of the accuracy of the model to predict patient prognosis at 2, 3, and 5 years in the training set (C) and the validation set (D).

