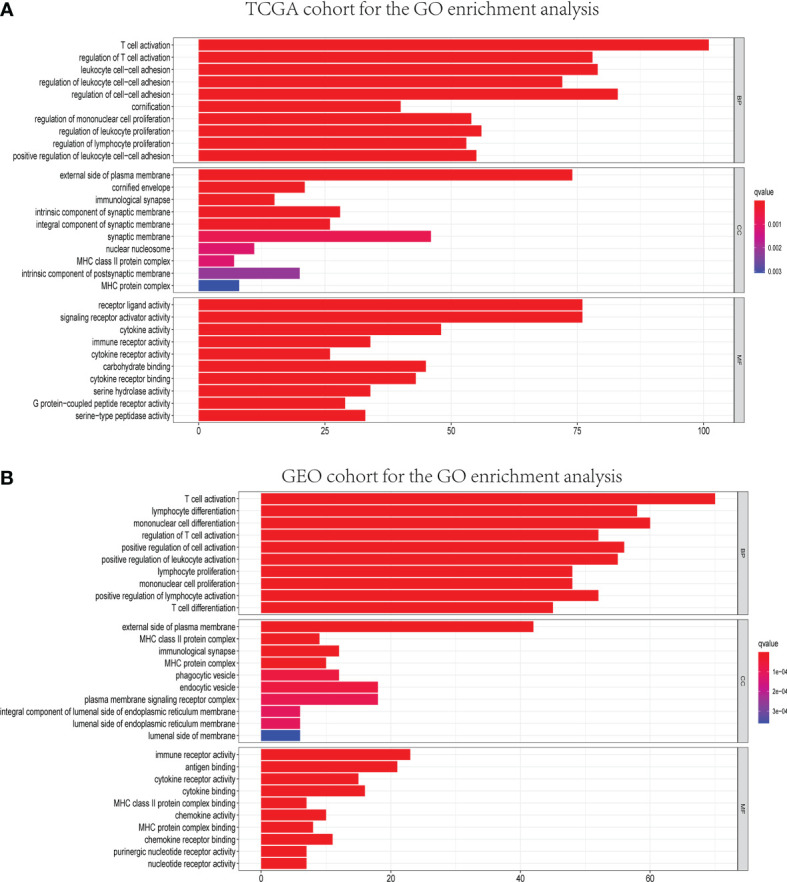
Figure 7.

Representative results of GO enrichment analysis in TCGA and GEO databases. The results of GO biological process enrichment, GO cellular component enrichment, and GO molecular function enrichment of DEGs between different risk groups in TCGA (A) and GEO (B) cohorts.
