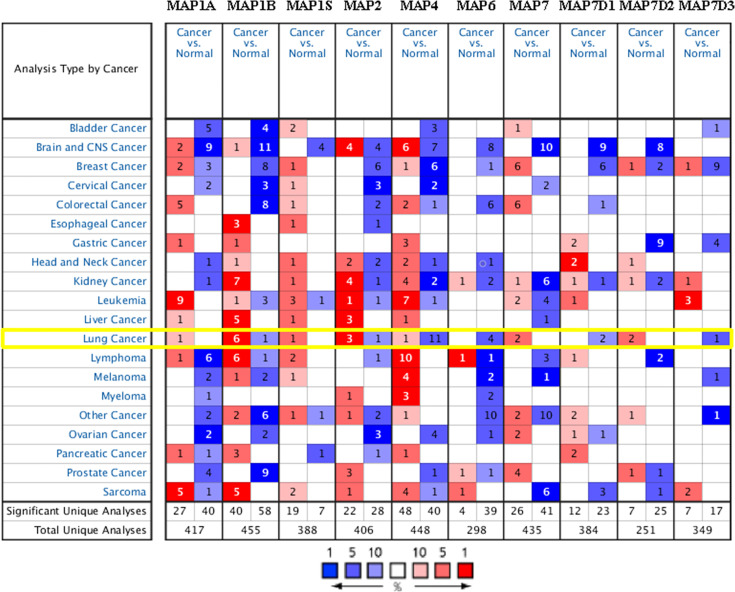
Figure 1.
Transcriptional expression of MAPs in 20 types of tumors (Oncomine database). Differences in mRNA levels of MAPs were compared by Student’s t-test. Cutoffs of p-value and fold change of expression levels were as follows: p-value: 0.01, fold change: 1.5, gene rank: 10%. MAP, microtubule-associated protein.

