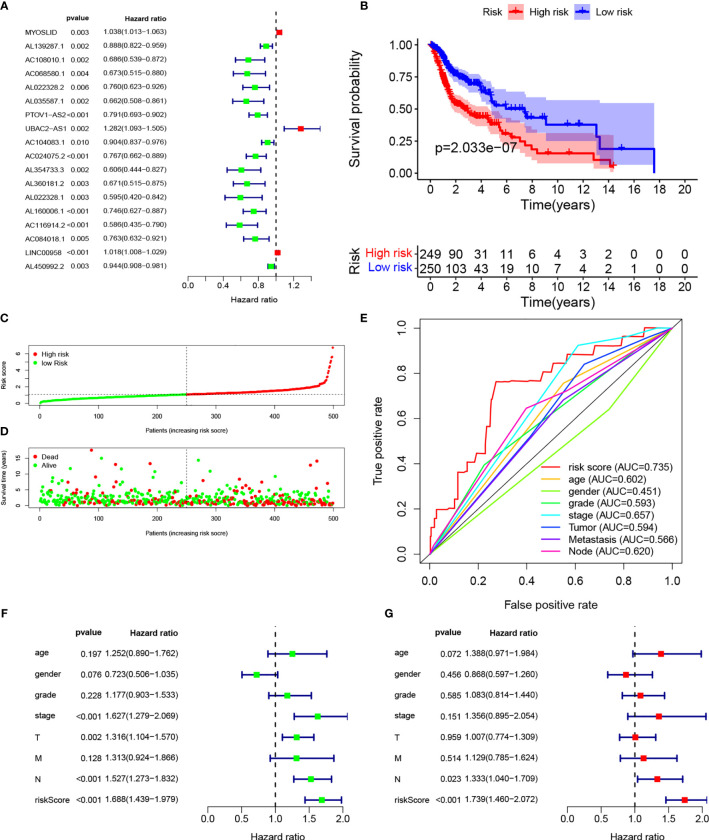
Figure 1.
Establishment of autophagy-related lncRNA signature for HNSCC patients. (A) Forest plot of univariate Cox regression for autophagic lncRNAs correlated with HNSCC prognosis. (B) Kaplan–Meier curves of overall survival for high- and low-risk groups. (C) Risk scores of the high- and low-risk groups. (D) Scatterplot of risk scores and survival time/survival outcomes. (E) ROC curves of prognostic signature and other clinical parameters. (F, G) Forest plots of univariate and multivariate Cox regressions, respectively, for association between risk score and overall survival.

