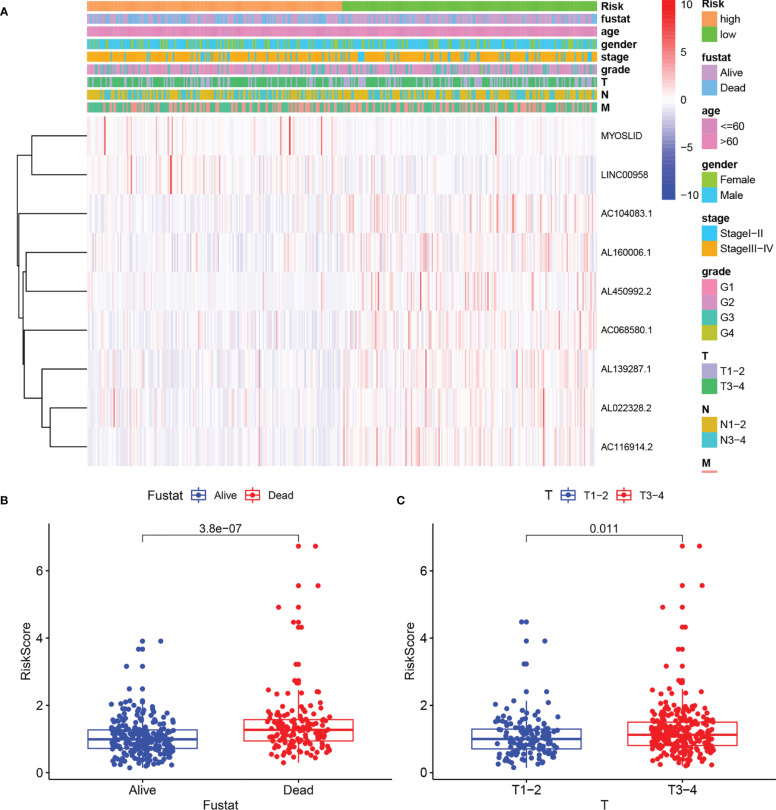
Figure 3.
Correlation of risk score with clinical parameters. (A) Heatmaps of clinical parameters and autophagy-related LncRNAs between high- and low-risk groups. (B) Boxplot of risk score difference between alive and dead groups. (C) Boxplot of risk score difference between T stage1–2 and T stage 3–4.

