Figure 5.
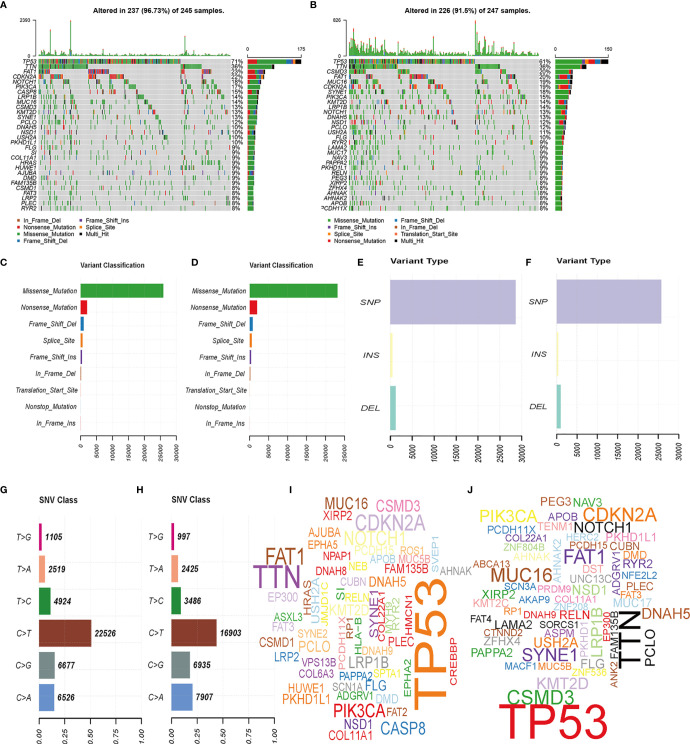
Landscape of mutation profiles between high- and low-risk HNSCC patients. (A, B) Waterfall plots of mutation information in each sample. (C, D) Variant classification. (E, F) Distribution of genetic alterations. (G, H) SNV classes. (I, J) Gene clouds of mutation frequencies in HNSCC patients.

