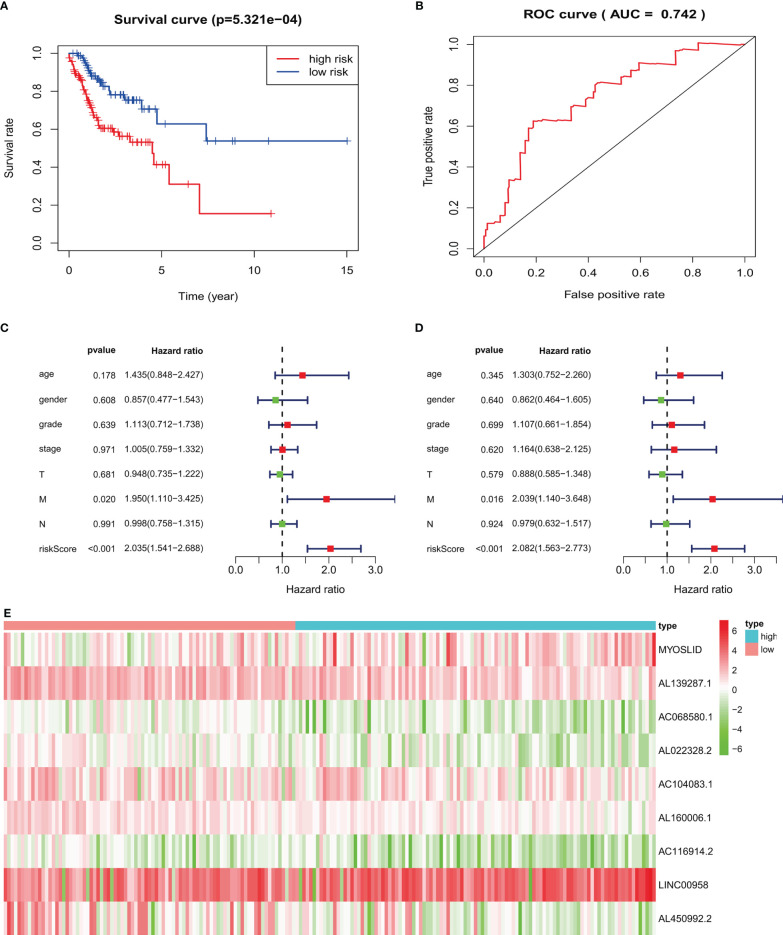
Figure 8.
Validation of prognostic signature in an independent HNSCC population: (A) high-risk HNSCC patients have poorer overall survival. (B) ROC curves of prognostic signature in validated HNSCC patients. (C, D) Forest plots of univariate and multivariate Cox regression, respectively, about association between risk score and overall survival in validated HNSCC patients. (E) Heatmap of nine target LncRNAs in high-risk and low-risk groups.

